
Datadog’s Multiple Assumes Cloud Spend Keeps Accelerating
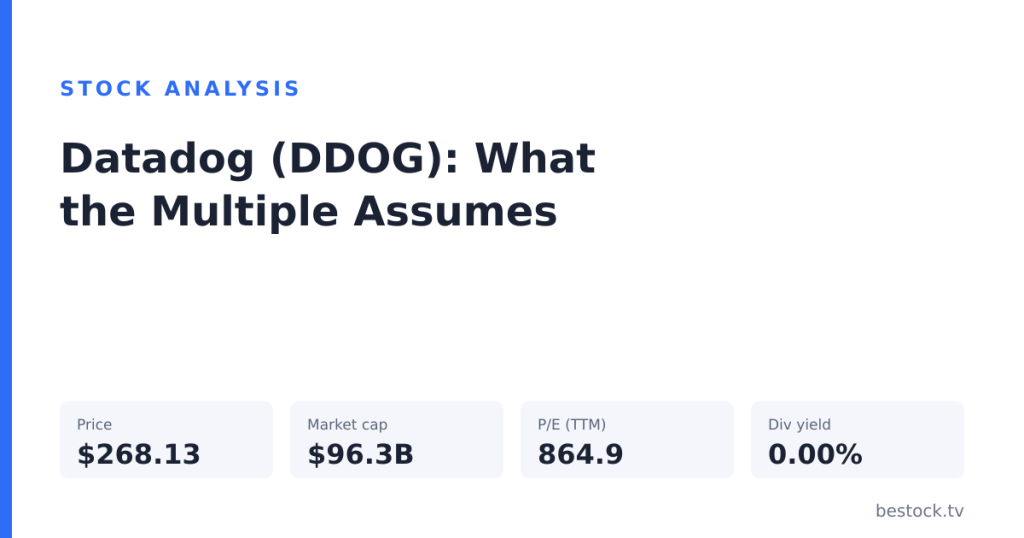
Datadog trades at $268.13 a share right now, carries a market capitalization of roughly $96.3 billion, and shows a trailing GAAP price-to-earnings ratio of 864.94. That last number isn’t a typo, and it isn’t really a valuation multiple either. It’s what happens when a $96 billion company reports almost no GAAP profit over a full year.
I read the SEC filing before I read anyone’s take on the quarter, and the filing tells a more useful story than the P/E does. Revenue for the quarter ended June 30, 2026 came in at $1.12 billion, up 36% year over year, ahead of the $1.07 billion to $1.08 billion range Datadog itself had guided to going in, a beat Yahoo Finance flagged the same day. That beat is the number actually carrying this stock. The P/E is closer to noise.
Datadog sells monitoring software that tracks whether a company’s applications and cloud infrastructure are working, priced mostly on how much data and how many hosts a customer runs through it. That pricing model is the reason the revenue line moves with how much compute customers are actually consuming, not with a fixed seat count the way older enterprise software used to work. It’s also why a slowdown in customers’ own cloud usage shows up in Datadog’s growth rate faster than it would for a company billing by user seats.
Here’s the case I keep coming back to: at 864.94 times trailing earnings, the market isn’t paying for what Datadog earned last year. It’s paying for growth staying close to that 36% pace and for the $100,000-plus customer cohort continuing to expand at close to the rate it just posted. Slow either one down for two quarters running, and there’s no earnings cushion anywhere in this stock to catch the fall.
A P/E ratio measuring almost nothing
Work the math backward and the earnings base looks thin. $96.3 billion divided by 864.94 comes out to roughly $111 million in trailing twelve-month GAAP net income, spread across a company doing more than a billion dollars of revenue in a single quarter. Datadog’s own release for the quarter ended June 30, 2026 shows GAAP net income of $44.6 million for that quarter alone, so more than a third of a full year’s trailing profit landed in the last three months by itself. A base that thin means one soft quarter, or one large stock-compensation charge, and the ratio swings by hundreds of points without the underlying business changing at all. Datadog’s financials page has the quarter-by-quarter detail.
I wouldn’t build a case on that number, and I doubt Datadog’s own finance team would either.
Part of the gap between the 23% non-GAAP operating margin and the much thinner GAAP profit is ordinary for software companies at this stage: stock-based compensation and amortization tied to past acquisitions both sit above the non-GAAP line and get added back before management reports it. That’s a standard reconciling item across the sector, not evidence Datadog is quietly burning cash. It’s still worth separating from the growth argument, because non-GAAP profitability and GAAP profitability are answering two different questions, and only one of them is what a trailing P/E is actually measuring.
Thirty-six percent, guided down from here
The growth number is the real story, and on its face it’s a good one. Revenue rose 36% year over year to $1.12 billion in the quarter, non-GAAP operating income was $257 million, and non-GAAP operating margin came in at 23%. Guidance for the next quarter puts revenue at $1.135 billion to $1.145 billion. Split the difference and that’s about $1.14 billion, roughly 2% above the quarter just reported, by my own math.
A 2% sequential step is an ordinary quarter for a company this size. It is not the shape of a growth curve still climbing at 36%.
That gap between the quarter just posted and the quarter being guided to is the deceleration signal here, not any single missed line item.
The $100k customer cohort, unit by unit
Datadog counted about 4,720 customers with annual recurring revenue of $100,000 or more in the latest quarter, up from about 3,850 a year earlier, a 23% increase. Set that against 36% revenue growth in the same release and the arithmetic says the average $100k-plus account is spending more too, since the customer count alone doesn’t explain all of the revenue gain. That’s a business selling more into an existing base rather than just adding new logos, usually the healthier of the two ways to grow. It also means the growth rate the market is underwriting depends on accounts that are already large getting larger, a harder trick to repeat every year than it was in year one.
I ran into a similar pattern looking at Salesforce’s own pricing bet: a mature SaaS name leaning on existing accounts spending more per seat rather than pure logo growth. Salesforce trades at a fraction of Datadog’s multiple for that reason, single-digit revenue growth against Datadog’s mid-thirties. Datadog’s premium only holds up if the $100k-plus cohort keeps compounding near 23% while total revenue growth doesn’t fall much further than the 36% just posted.
Usage-based pricing cuts both ways here. It’s what let Datadog’s revenue beat guidance this quarter, because customers ran more workloads through the platform than the company itself expected when it set that guidance. The same mechanism works in reverse the moment a handful of large customers start optimizing cloud costs, trimming the hosts and data volume they send through observability tools first, since that spend is easier to cut on short notice than payroll or the underlying cloud bill itself.
What this quarter’s release left out
One thing I couldn’t pin down from this release: Datadog didn’t put a specific net revenue retention percentage in the numbers section of the announcement this quarter. Retention is the figure that would tell me whether existing customers are spending more per account over time or whether the $100k-plus cohort’s growth is being carried by a smaller group of accounts spending a lot more each. I don’t have a verified figure for it this quarter, so I’m not putting a number on it here. I’d treat the absence as a small flag worth checking again once the 10-Q is out, not as proof of anything by itself.
| Metric | Datadog now | Context |
|---|---|---|
| Revenue growth (Q2 2026, YoY) | 36% | to $1.12 billion |
| Non-GAAP operating margin | 23% | $257 million non-GAAP operating income |
| GAAP net income (Q2 2026) | $44.6 million | single quarter |
| $100k+ ARR customers | ~4,720 | up from ~3,850 a year earlier, +23% |
| Q3 2026 revenue guidance | $1.135B-$1.145B | ~2% above Q2, by my calculation |
| Trailing P/E (GAAP) | 864.94 | implies ~$111 million trailing net income |
| Market cap | ~$96.3 billion | as of September 26, 2026 |
| Dividend | None | fully reinvested in growth |
That table is the whole argument in one place: a fast-growing top line sitting on top of an earnings base too thin for the P/E column to mean anything.
A stock with no cushion if growth slips
None of this makes Datadog a bad business. It makes it a stock priced for one outcome, with little room in the current multiple for a second outcome. No dividend, a GAAP P/E north of 800, and a growth rate already guided down from 36% toward something closer to the low-thirties by the company’s own sequential math: that combination tends to move hard in both directions on earnings day. I wrote about how I handle sizing on names like this in a post on position sizing when beta runs above 2, and Datadog is exactly the kind of name that post was written for.
Here’s the specific way this goes wrong: the $100k-plus cohort’s growth rate slides toward the high teens over the next two quarters while total revenue growth cools into the high twenties, the two numbers moving down together instead of one offsetting the other. That combination is what would make me size down rather than add, because it removes the one thing propping up an 864.94 P/E: the belief that the growth rate itself is still climbing, not just staying high.
I haven’t weighed how much of the non-GAAP operating margin gain is durable cost discipline versus a lighter year for hiring, and I’m leaving that out here because I don’t have the headcount data in front of me to separate the two. That’s a real gap in this analysis, not a footnote.
The number I’m watching next
The number I’m watching next is $1.145 billion, the top of Datadog’s own guidance range for the third quarter. Revenue beat the top end of its second-quarter guidance by roughly $40 million this time. Another beat of similar size keeps the growth story credible at this price. A print that lands inside the guided range, with no beat attached, would be the first real evidence that the deceleration already built into guidance is turning into something worse.
Analysis and opinion only, not investment advice. Figures on revenue, margins, net income, and the $100k-plus customer count come from Datadog’s Form 8-K for the quarter ended June 30, 2026, filed with the SEC; the prior guidance range and quarter-over-quarter context come from Yahoo Finance’s coverage of the same results. Price, market cap, and the trailing P/E are from BeStock’s quote data as of September 26, 2026, and are approximate; the sequential growth math and the trailing-earnings estimate are my own calculations.