
Morgan Stanley (MS) at 16.4x Earnings After a Record Quarter
Morgan Stanley‘s wealth arm took in a record $148 billion of net new assets in the second quarter, and more than half of it, according to the company’s own release, came from IPO-related inflows in the workplace channel. That detail matters more than the headline, because a number that big invites you to multiply it by four and call it a trend. I would not.
The stock trades around $202.58 as I write this, about 12.3% below its 52-week high of $231 and 36% above its low of $148. The question I want to answer is narrow: after a record quarter, is there still a reason to pay 16.4 times trailing earnings for it?
What the record quarter contained
The quarter itself was strong by any standard. Per Morgan Stanley’s second-quarter 2026 earnings release filed with the SEC, net revenues were $21.3 billion against $16.8 billion a year earlier, and net income applicable to the firm was $5.6 billion, or $3.46 per diluted share, against $2.13 in the same quarter of 2025. Chairman and CEO Ted Pick called both figures records. Equities trading revenue jumped 69% according to press coverage of the results, and Institutional Securities alone produced about $11.0 billion of revenue. I pulled these figures from Morgan Stanley’s financials page, which updates each quarter.
Read that again. The headline beat came from the trading and banking side, not from wealth. Wealth Management had a record quarter too, with net revenues of about $8.9 billion and a pretax margin of 30%, and total client assets across wealth and investment management reached $10 trillion, a target management had talked about for years. But the biggest swing factor in the quarter’s EPS was a very good market for equities desks.
That is the first place I want to be careful. Morgan Stanley has spent a decade telling investors that it is a fee business with a trading arm, not a trading house with a fee arm. The story is largely true and it explains why the multiple sits where it does. A quarter in which trading does the heavy lifting is a nice quarter. It is not evidence for the thesis.
Why $148 billion overstates the run rate
Net new assets are the most watched number in wealth management because they are the raw material for fees. If assets arrive at 5% of the base each year and markets do nothing, revenue still grows. So a quarterly figure of $148 billion on a base of roughly $10 trillion looks like an annualized inflow rate above 5% before you even count the market gains.
Now strip out the IPO money. If more than half of the quarter’s inflow came from employees of newly public companies parking proceeds and shares in workplace accounts, the underlying organic figure is under $74 billion. Annualized against a $10 trillion base, that is a little under 3%. Still positive, still healthy for a firm this size, but a different pace from the headline. And IPO-linked inflows behave like weather, not like climate. They depend on which private companies list, when lockups end, and whether employees keep the money in place.
I read this as good news with an asterisk. The asterisk matters because the multiple is built on the durability of fee growth, and durability is exactly what one-time liquidity events do not prove.
The multiple against its own history
Here is what my database shows for the valuation, all as of September 18, 2026.
| Metric | Now | Five-year average | Comment |
|---|---|---|---|
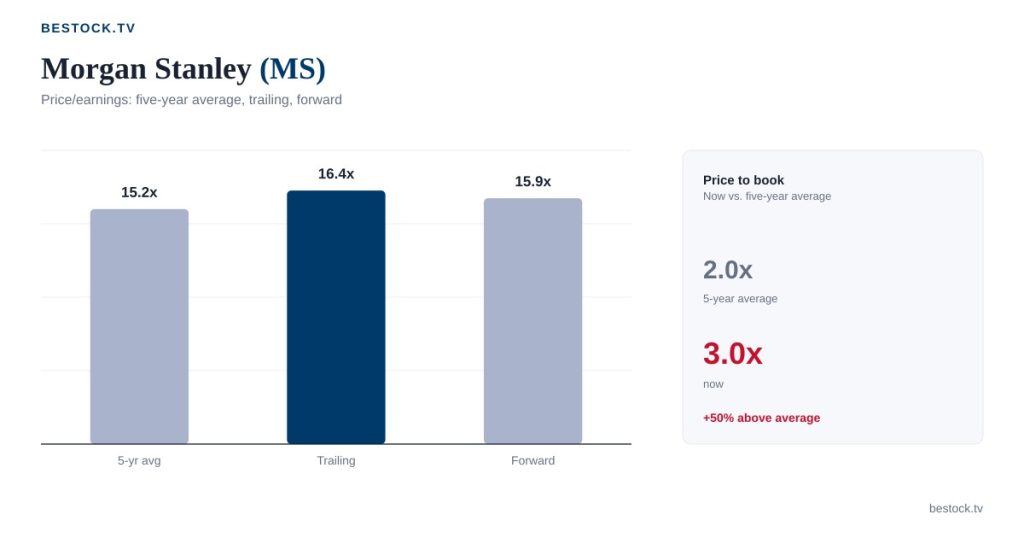
| Price / earnings (trailing) | 16.4 | 15.2 | About 8% above average |
| Price / sales | 4.2 | 3.1 | About 35% above average |
| Price / book | 3.0 | 2.0 | 50% above average |
| Forward P/E | 15.9 | n/a | On forward EPS of $12.73 |
| Dividend yield | 1.97% | n/a | $4.00 per share over twelve months |
The trailing P/E is the least dramatic number on that page. 16.4 against a five-year average of 15.2 is a modest premium. Price to sales and price to book tell a louder story: the market pays noticeably more for each dollar of revenue and each dollar of equity than it did on average over the last five years. For a bank that is a real statement. Book value matters for financials, and paying 3.0 times book against a two-times history means the stock is priced for returns on equity that stay high.
One more figure, and it is where I think the debate really sits. Trailing EPS in my data is $12.38. Forward EPS is $12.73. That is growth of about 3%. Yet the second quarter alone earned $3.46, and four times that is $13.84. If the record quarter were a normal one, the stock would be at roughly 14.6 times a run rate that consensus does not expect to hold. So the forward number is quietly saying something: analysts do not believe Q2 repeats. I agree with them, and I think a holder should too.
Fees are the business, and the price shows it
Revenue for 2025 was $66.0 billion against $57.6 billion in 2024 and $50.2 billion in 2022, so sales are up about 14% in the latest year and roughly 31% over three years. Net income moved from $13.5 billion to $17.0 billion, a net margin of 26%. That profit growth outran revenue growth, which is what a fee business with fixed costs is supposed to look like.
I have written before about how banks look after the rate-cut turn, in my note on net interest margin and deposit betas. Morgan Stanley is the bank least exposed to that story. It has a smaller deposit-funded lending book than the universal banks, so falling rates hurt it less, and its wealth revenue depends on asset levels and client activity, which is a different sensitivity. When I lined up the four largest US banks after the second quarter in a single table, Morgan Stanley was the one where I found myself asking about equity markets rather than credit.
That is the appeal, and it is also the exposure. A wealth franchise with $10 trillion of assets earns fees that rise and fall with the level of stock and bond prices. Assets that have been lifted by a strong market are assets that a weak market lowers. The 30% margin in wealth is a margin at a good moment, and pretax margins in businesses with heavy compensation costs compress fast when revenue dips.
What the price already assumes
Take the analysts at their word for a moment. Fourteen of them have an average target of $245, with a range from $215 to $262, and 57% rate the stock a buy. The average implies about 21% upside from here. The low target still sits 6% above the price, which tells me almost nobody covering the stock is calling it expensive, and that is a data point I treat with caution. When the entire range is above the price, the marginal buyer has already been recruited.
The reverse-DCF logic I used in a piece on what a P/E of 35 requires works at a lower multiple too. At 15.9 times forward earnings and a 1.97% dividend yield, a buyer is paying for roughly high-single-digit earnings growth plus the dividend to earn a double-digit return. Morgan Stanley pays out about a third of its trailing EPS ($4.00 against $12.38), which leaves plenty for buybacks and for retaining capital, but I would not count on a re-rating to do any of the work. The multiple already sits above its own average. What remains is ordinary equity return: earnings growth plus the dividend.
There is also a small detail on how the market took the news. On the day after the report, per my data, the stock moved +0.4%. The average earnings-day move over recent quarters is about 3.8%. A record report that produced almost no reaction is what a well-anticipated beat looks like. It does not mean the stock is wrong. It means the good news was in the price before the release.
The case where I am wrong
A bull would say I am too cautious. Wealth managers with sticky client relationships deserve a premium, the equity franchise is the strongest on the Street, and management has now proven it can grow assets at a pace that supports fees. If equity markets keep rising and IPO activity stays hot, the workplace channel becomes a genuine growth engine, and the stock could grind toward the average target of $245 without a single re-rating.
The risk to my view is plain: this outcome could happen, and it would make me wrong. What I cannot do is call it the base case, because it requires three things at once: markets that keep rising, listings that keep coming and clients who keep their new money in place after lockups. Miss one and the excess in the quarter fades. Miss two and a 16 to 17 times multiple on $12.73 of forward earnings starts to look full rather than fair.
My uncertainty is mostly about the workplace channel. I do not know how much of that IPO cash stays for years and how much leaves for the next house purchase or tax bill. Morgan Stanley did not disclose retention in the release I read, so I am guessing, and I want to say so plainly.
What the next two prints must show
I would call Morgan Stanley a good business at a fair price, and a fair price is a different thing from a cheap one. It suits an investor who wants fee income, a dividend near 1.97% and earnings growth in the high single digits, and who does not need the multiple to expand. It does not suit someone looking for a bargain after a beat.
The next thing to watch is net new assets excluding IPO-related inflows. If that figure holds above roughly 4% annualized while the wealth pretax margin stays near 30%, I would say the fee thesis is intact and the multiple is defensible. If organic inflows slip toward 2% and the margin falls below 27%, the stock is priced for a business it no longer is. Beyond that, consensus forward EPS is the number to track: a move below $12 would tell me the market has begun to treat the record quarter as the peak.
Analysis and opinion only, not investment advice. Figures come from Morgan Stanley’s second-quarter 2026 earnings release, its other filings on SEC EDGAR and CNBC’s coverage of the report; valuation multiples are approximate and were checked on September 22, 2026.