
American Express at 18.9 Times Earnings: Premium or Fair Price?
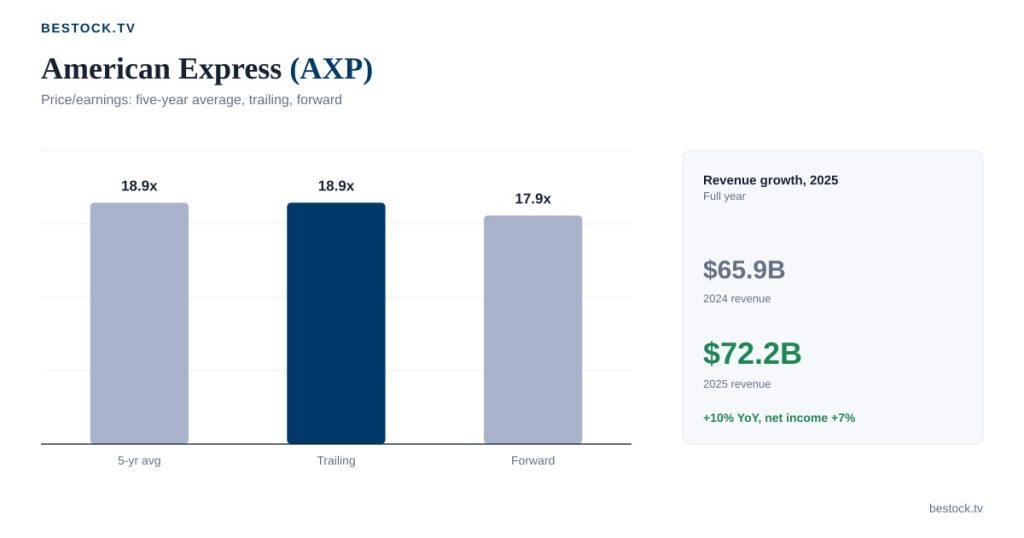
American Express grew revenue by 10% in 2025, from $65.9 billion to $72.2 billion. Net income grew by about 7%, from $10.1 billion to $10.8 billion. That gap of three points is the whole debate about the stock, and it is smaller than it sounds only if you are not the one paying 18.9 times trailing earnings for it.
The shares trade around $311.56 as I write this, roughly 18.9% below the 52-week high of $384 and only 8% above the low of $289. Market value is about $210.4 billion. On trailing earnings of $16.48 per share the multiple is 18.9, which happens to be the same as the five-year average of 18.9. So the stock is not expensive against its own history. The question is whether that history deserves a premium to a typical lender, and my view is that it does, though a narrower one than the market sometimes pays.
Why Amex is not Visa with a lending arm
Most people file American Express next to Visa and Mastercard. That filing is lazy. The two big networks move data and take a small fee, while banks issue the cards and carry the losses. Amex issues its own cards, picks its own customers, and keeps the credit risk on its own balance sheet. It is a closed loop: the company sits on both sides of the swipe.
That structure has a cost and a payoff. The cost is that a recession hits its loan book directly, so it cannot be valued like a toll road. The payoff is that it sees the whole relationship. It knows what a cardholder spends and how they repay, and it sells an annual fee on top. I think of it as a membership club that happens to settle payments, a comparison that also explains why Costco’s membership fee changes the valuation argument for a different business. In both cases a recurring fee from loyal customers is worth more than the transaction it rides on.
Compare it with a pure payments name such as PayPal, where the debate is about take rates and competition at checkout. Amex faces a different fight: keeping wealthy households happy enough to pay several hundred dollars a year for a card. When that works, the earnings are steadier than a mass-market lender’s. When it stops working, the fee income and the spending volume soften together.
What the numbers say about growth
Revenue reached $72.2 billion in 2025 after $65.9 billion in 2024; three years earlier, in 2022, it was $52.9 billion. That is about 10.9% a year over three years, a pace most banks would happily take. The latest quarter, per the database, came in at $19.6 billion, up 10% from a year earlier and 4% above the prior quarter.
The company’s own second-quarter release, published on July 24, 2026, gives the fuller picture. Diluted EPS was $4.53 against $4.08 a year earlier, up 11%. Revenue net of interest expense rose 10% to $19.6 billion, and billed business rose 9% to $455.8 billion, according to the earnings release on the investor site. Management raised the full-year revenue growth guide to 10%, from a range of 9% to 10%, and left EPS guidance at $17.30 to $17.90. It also said it would spend part of the upside on growth initiatives instead of letting it drop to profit.
That last sentence is the one I keep rereading. Spending the upside on customer acquisition and rewards is what a company does when it thinks the franchise can grow for years. It is also what compresses the earnings growth below the revenue growth. Both readings are fair. I lean toward the first, because the alternative is a company harvesting its base, and nothing in the numbers looks like harvesting.
Revenue at 10%, earnings at 7%
Here is the arithmetic. The midpoint of the EPS guide is $17.60. Against trailing EPS of $16.48, that implies earnings growth of about 7% for this year, and the database’s forward EPS of $17.45 points to something similar, an implied 6%. Revenue is guided to 10%. So the profit line is growing slower than the sales line, and net margin sits at 15%.
Why does that matter for valuation? A premium multiple is a bet that earnings compound faster than the market average. If revenue grows at 10% and earnings grow at 7%, the difference is going into rewards and marketing, plus credit provisions. That is a choice, and choices can be reversed. If management eases off the investment, EPS growth converges toward revenue growth. If credit losses rise, the gap widens for the wrong reason. I cannot tell from outside which one comes first, which is the honest uncertainty in this stock.
| Measure | Value | Context |
|---|---|---|
| Price | $311.56 | 52-week range $289 to $384 |
| P/E, trailing | 18.9 | five-year average 18.9 |
| P/E, forward | 17.9 | on forward EPS of $17.45 |
| Price to book | 6.5 | five-year average 5.8 |
| Price to sales | 2.9 | five-year average 2.8 |
| Revenue 2025 | $72.2 billion | up 10% on $65.9 billion |
| Net income 2025 | $10.8 billion | net margin 15% |
Is the premium still there?
Price to earnings equals its average. Price to book is 6.5 against a five-year average of 5.8, which is a modest stretch, and price to sales is 2.9 against 2.8. Nothing here says the market has gone euphoric. If anything, the stock is at its ordinary premium after falling 18.9% from its high.
That fall is worth a second look. The stock has already had its air let out, and the last earnings day produced a move of -4.3% on July 24, even though the print beat estimates on EPS. The average earnings-day move is 4.4%, so that reaction was ordinary in size. I would not read it as a verdict, and I will not tell you what caused it, because the sources I checked do not say. A stock that dips on a beat usually reveals that expectations were higher than the numbers.
Analysts are more optimistic than the price. Among 19 covering, the average target is $381, about 22% above the current price, and the range runs from $315 to $425. Only 53% rate it a buy, which is lower than I expected for a name with that much upside. The low target sits just 1% above the price, so even the most cautious analyst sees no loss. Targets are opinions, not forecasts, and I do not lean on them. They do show that the debate is about how much upside, not about direction.
The dividend adds a little. It pays $3.54 a share over the last year, a yield of 1.14%. That is about 21% of trailing earnings, so the payout leaves plenty of room for buybacks and for the growth spending I mentioned. Nobody buys this for income.
The customer base is the moat
A brand is easy to copy and a customer base is not. The people who carry an Amex premium card are, on average, wealthy and spend a lot, and they take the fees because the perks pay back. That is a different profile from a subprime borrower running a balance at 28%. It means credit losses tend to be lower and more predictable, and that spending volume holds up better when the economy slows down.
I would not lean too hard on that. The 9% growth in billed business tells me people are still spending on these cards. It does not tell me how they will behave in a real slowdown. Affluent households own assets, and assets fall in price. A sharp equity drawdown can trim spending at the top even when jobs are fine. That is a different kind of downturn from the one bank stocks are usually tested on, and I think it is the one that would matter most here.
Management also flagged that card-fee growth should speed up in the second half, with a high-teens exit rate for 2026. Fees are the most stable line in the model, because they recur and are paid upfront. If they accelerate as promised, that supports the premium far better than any spending number. If they do not, the multiple loses its best excuse.
The cross-check I use is a peer with a different model. A bank that earns most of its money from net interest, such as SoFi, will move with rates and funding costs in a way Amex only partly does. Amex earns from merchant discount revenue, card fees and interest income, so one line can soften while the others carry the year.
Where this thesis breaks
Credit comes first. Amex keeps its losses, so a jump in write-offs comes straight out of earnings, and with earnings growing slower than revenue there is less cushion. Next is the cost of chasing growth: if rewards and marketing keep eating the upside for several years, the stock deserves a lower multiple than it has now. Last is the affluent wealth effect described above.
There is also a valuation counter-case. At 17.9 times forward earnings, the price already assumes the company hits its guide. A shortfall of even a dollar on the $17.30 low end would push the multiple up by about half a turn without any change in price. That is not a disaster, but it removes the margin for error.
Short interest is only 1.5% of shares, so this is not a stock that bears are piling into. Our own quant grade for it is D, unchanged from before, which tells me the numbers are middling by the model’s standards, not broken.
What I would wait for
Fair price for a good franchise is not a bargain, and I will not pretend otherwise. At $311.56 I see a company priced at its own average with revenue growing 10%, which is a reasonable place to start a position for someone who wants steady compounding and can tolerate a bad quarter. It is not a place to bet the year.
The number I would watch is the third-quarter EPS against the guide. If the company is on pace for the $17.30 to $17.90 range and card-fee growth is visibly accelerating, the premium is earned and a pullback toward the low $290s would be an entry I would take seriously. If EPS growth slides under 5% while revenue keeps rising at 10%, the investment spend is not turning into profit, and I would want the multiple nearer 16 before I bought.
Analysis and opinion only, not investment advice. Figures come from American Express filings on SEC EDGAR and its investor site; valuation multiples are approximate and were checked on September 22, 2026.