
JPMorgan, Goldman, Morgan Stanley, BofA: One Table

JPMorgan trades at 15.0 times trailing earnings. Goldman Sachs trades at 14.5 times. Morgan Stanley sits at 16.4, and Bank of America at 13.3. All four get filed under the same mental folder, “big bank, rates play,” and that folder is doing a lot of hiding.
My thesis: these four banks earn money in different enough ways that pricing them off one shared “bank multiple” hides more than it reveals, and the stock that looks cheapest on paper is not always the cheapest one once you adjust for what actually drives its return.
Short version: balance sheet, trading, fees and deposits are four different businesses wearing the same “bank” label.
JPMorgan prices its balance sheet
JPMorgan is a $929.5 billion company, the largest of the four by a wide margin, and its size is the product it sells as much as any single business line. A bank with $929.5 billion in market value and a trailing return on that scale can underprice smaller competitors on lending and still make it back on volume, the same scale-does-the-work logic behind why Apple’s services margin matters more than unit growth. Revenue over the trailing year is $181.8 billion, up 7%, and the most recent quarter grew 18% year over year. Net margin sits at 31%, the kind of figure that is only available to a bank with JPMorgan’s mix of low-cost deposits and diversified fee income.
The market does not treat this as a growth stock, and it should not: 15.0 times earnings against a five-year average of 11.9 says the multiple has already expanded past its own history, not that the market is ignoring the business.
Goldman still trades like a trading desk
Goldman is the one whose results swing the most on any given quarter, because a large share of its revenue comes from trading and underwriting rather than from interest income that resets slowly. Its trailing net margin of 29% is the highest of the four, and its most recent quarter grew 39% year over year, well ahead of the group. That growth number is also the one I trust least as a repeatable input, since trading revenue can fall as fast as it rises when markets go quiet.
Goldman’s forward P/E of 13.8 sits below its trailing 14.5, meaning analysts expect earnings to grow into the current price rather than the price catching up to earnings. Buy ratings cover 46% of the 13 analysts tracking it, with an average target of $1,203, implying 28% of upside from here. I ran the same kind of screen across five retail names and found that a single ranking number rarely survives contact with how differently each business actually earns; Goldman is the clearest bank-sector example of that same problem.
Morgan Stanley sells stability, not loans
Morgan Stanley has spent a decade shifting away from being a trading-and-banking shop toward being a wealth and investment management firm, and the numbers show a business that behaves less like a bank now than it used to. Revenue over the trailing year is $66.0 billion, growing 14%, with net margin at 26%. That combination of growth and margin, in a business built on fee income rather than loan spreads, is why the stock has historically carried a premium multiple inside this group: 16.4 times trailing earnings versus a five-year average of 15.2.
Fee-based revenue is stickier than trading revenue and less sensitive than loan income to a single rate decision, which is the case for paying up for Morgan Stanley. It is also, if you’re the skeptic in the room, a business whose assets under management can shrink in a bad market year even without a single loan going bad, so the stability is relative, not absolute.
Bank of America is the cheapest for a reason
Bank of America trades at 13.3 times earnings, the lowest multiple of the four and below its own five-year average of 12.2. It is also the most straightforwardly a deposit-and-lending bank of the group, with a $403.7 billion balance sheet built on a retail deposit base that costs less to fund than market borrowing. Net margin is 27% on $113.1 billion of trailing revenue, both solid figures, just less spectacular than Goldman’s trading-driven numbers this year.
Cheap for a reason is not the same as cheap for a bad reason. Bank of America’s discount reflects a business more exposed to net interest income, which moves slowly with the rate cycle in both directions, rather than any specific problem with credit quality that I can point to in the numbers available to me. Buy ratings cover 88% of 16 analysts, the highest share of the group, with 19% of average upside to target.
Four multiples in one place
| Metric | JPMorgan | Goldman Sachs | Morgan Stanley | Bank of America |
|---|---|---|---|---|
| Price | $349.67 | $942.00 | $202.58 | $57.73 |
| P/E (TTM) | 15.0 | 14.5 | 16.4 | 13.3 |
| P/E vs 5-yr avg | 11.9 | 13.3 | 15.2 | 12.2 |
| Revenue growth | 7% | 9% | 14% | 7% |
| Net margin | 31% | 29% | 26% | 27% |
| Price/book | 2.7 | 2.6 | 3.0 | 1.6 |
| Dividend yield | 1.72% | 1.80% | 1.97% | 1.94% |
| Analyst buy rate | 67% | 46% | 57% | 88% |
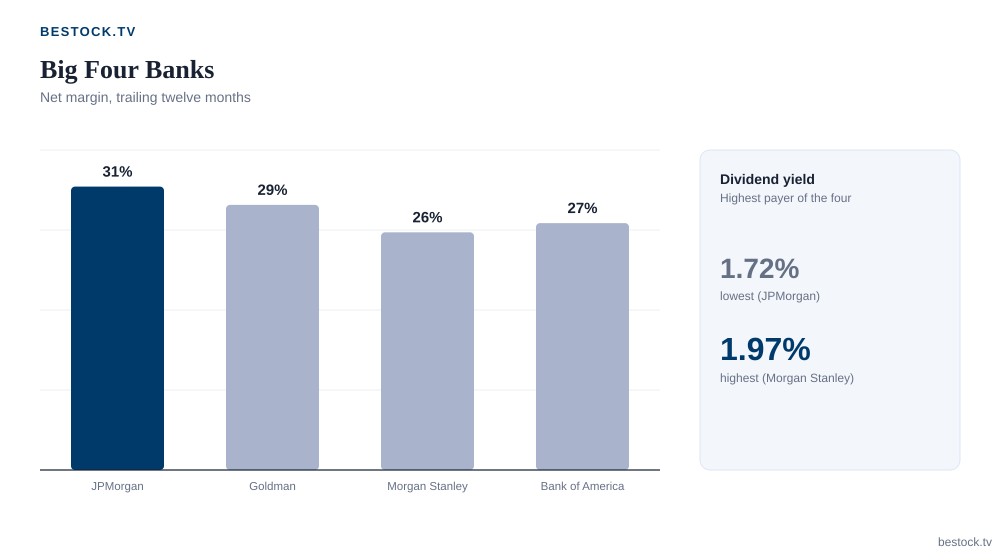
Line them up and the pattern is not “cheap bank, expensive bank.” It is four different answers to the question of where a bank’s return actually comes from: balance sheet scale at JPMorgan, market cycles at Goldman, fee income at Morgan Stanley, deposit funding at Bank of America. A screening tool that just sorts by P/E, the way Seeking Alpha’s quant ratings try to condense dozens of factors into one score, will rank these four in an order that says almost nothing about which business model you are actually choosing.
Price-to-book is the more honest yardstick for a bank than P/E, since a bank’s assets are mostly financial instruments carried close to their real value rather than factories and inventory. Morgan Stanley trades at 3.0 times book, the richest of the four, which is the market paying up for a fee-driven business that needs less balance sheet to earn a dollar. Bank of America, at 1.6 times book, is priced as if its balance sheet earns less per dollar of equity than the other three, and on trailing net margin of 27% that is at least defensible, even if I think it undersells the deposit franchise underneath it.
What the dividend yields are actually pricing
Dividend yield across this group runs from 1.72% at JPMorgan to 1.94% at Bank of America, a spread that has less to do with generosity and more to do with price. A lower yield next to a higher multiple, which is JPMorgan’s combination, says the market is comfortable paying for growth and buybacks over current income. A bank trading at a lower multiple with a similar or higher yield, which describes Bank of America relative to JPMorgan, is being priced for slower growth, and the yield is compensation for waiting rather than a reward for outperformance. I don’t see dividend coverage as the real differentiator here; net margins across the group run from 27% to 29%, and none of the four looks like it is straining to fund its current payout out of trailing earnings.
Picking one over the other three
I would start with what you are trying to own, not which multiple is lowest. Someone who wants exposure to trading volatility and is comfortable with a choppier ride should look at Goldman, where 39% quarterly growth is real but not guaranteed to repeat. Someone who wants a bank that behaves less like a bank, with fee income smoothing out the loan cycle, is paying up for Morgan Stanley on purpose. JPMorgan is the scale bet: it costs more relative to its own history, and it is the hardest of the four to disrupt. Bank of America is the rate-cycle bet, priced like one.
The risk across all four, and the reason I would not treat any single name here as a slam dunk, is straightforward: if net interest margins across the group slow or credit costs rise faster than reserves are built for, the entire group re-rates down together regardless of which business mix a given bank has, because deposit funding costs and loan losses eventually touch every large bank’s book. I would watch whether net margins at all four hold roughly where they are now through the next two reporting quarters; if two or more of them compress at the same time, that is a rate-cycle problem, not a stock-picking one, and the “buy the cheapest one” framing stops working entirely.
That is also why I would not build a position around a single quarter’s headline beat from any of the four. A trading-driven quarter at Goldman tells you about markets that week, not about the franchise. A soft quarter at Bank of America tied to deposit costs tells you about the rate cycle, not about whether the retail bank is losing share. The more useful exercise is checking each bank’s numbers against its own trailing average rather than against the other three, since a JPMorgan that is expensive relative to its own five-year history is a different signal than a JPMorgan that is merely expensive relative to Bank of America, which has never traded at JPMorgan’s multiple even in good years.
Analysts, for what it’s worth, are not split the way retail sentiment sometimes is. 67% of the 15 covering JPMorgan rate it a buy, 46% of 13 for Goldman, 57% of 14 for Morgan Stanley, and 88% of 16 for Bank of America. That is broad institutional comfort with the group as a whole, and it is itself a mild caution: when coverage agrees this much, the disagreement that matters has usually already moved into the multiple rather than the rating.
Analysis and opinion only, not investment advice. Figures come from JPMorgan’s and Bank of America’s investor sites (JPMorgan, Bank of America) and from SEC EDGAR filings for all four banks (JPMorgan, Goldman Sachs, Morgan Stanley); valuation multiples are approximate and were checked on September 23, 2026.