How I Size a Position When Beta Is Above 2
Take two stocks and give each a 5 percent slot in a $100,000 portfolio. One has a beta near 1, the other near 2.5. The market falls 20 percent over a rough quarter. The first slot loses about $1,000, which is 1 percent of the whole account. The second loses about $2,500, which is 2.5 percent. Same weight, same market, two and a half times the damage. That gap is the whole argument of this post.
I think most position-sizing mistakes are not stock-picking mistakes. They are the result of treating every slot as if it carried the same risk. A 5 percent position sounds like a rule. It is only a rule if each 5 percent behaves alike, and with high-beta names it does not.
What beta measures and what it hides
Beta compares a stock’s returns with the returns of a broad index over a trailing window, commonly five years of monthly data or two years of weekly data, depending on the data vendor. A beta of 1 means the stock has tended to move with the market. A beta of 2 means that in the sample, a 10 percent market drop came with something like a 20 percent drop in the stock. It is a regression slope, nothing more.
Three limits matter. First, it looks backward, and a company that changes shape (a software firm that becomes a hardware maker, a lender that changes its mix) can carry a stale number for years. Second, different vendors report different betas for the same ticker, because the window, the return interval and the index differ. A 1.8 on one page and a 2.4 on another is normal. Third, beta says nothing about quality. A great business and a poor one can share the same beta, and the number tells you only how violently the market’s mood passes through the stock.
That last point is why I like it for sizing and not for picking. Valuation work tells me whether I like a company. Beta tells me how much of my patience the position will consume. Those are separate jobs.
That is simple to say, and easy to skip when a stock is exciting.
The rule: divide the base weight by beta
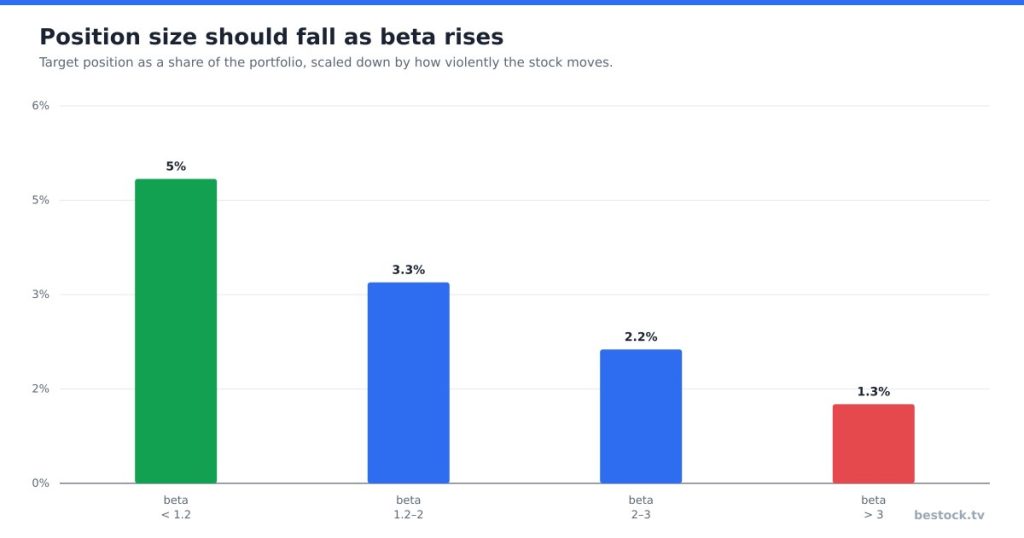
Here is the adjustment I would apply. Pick a base weight for a stock with a beta of 1, say 5 percent. For any other stock, divide the base weight by its beta. A beta of 2.5 gets 2 percent. A beta of 0.8 gets about 6 percent. The result is that every position contributes roughly the same loss in a market-wide selloff, which is the one scenario beta actually describes.
| Beta | Weight at the same market risk | Loss in a 20% market drop (portfolio) | Loss at a flat 5% weight |
|---|---|---|---|
| 0.8 | 6.3% | 1.0% | 0.8% |
| 1.0 | 5.0% | 1.0% | 1.0% |
| 1.5 | 3.3% | 1.0% | 1.5% |
| 2.0 | 2.5% | 1.0% | 2.0% |
| 2.5 | 2.0% | 1.0% | 2.5% |
| 3.0 | 1.7% | 1.0% | 3.0% |
The right-hand column is the one to stare at. At a flat 5 percent, a beta-3 stock costs three times what a beta-1 stock does when the market breaks. Nobody chooses that on purpose. It happens because the slot size was decided before the volatility was looked up.
I would not follow the grid mechanically. A 1.7 percent position in something I believe in is close to a rounding error, and at some point a slot is too small to be worth the monitoring. I would set a floor of around 1.5 percent, and if beta pushes a name below it, I would ask whether I want the stock at all, or just the feeling of owning it.
A worked example with Tesla’s range
Beta is a market-relative number, so it cannot capture everything a stock does on its own. Tesla makes the point well. According to the data behind this site, Tesla trades around $364.27 as I write this, with a 52-week high of $499 and a low of $297. That puts the shares about 27.0% below the high, and only 22% above the low.
Now run the hypothetical. Suppose a holder had put 5 percent of a portfolio into Tesla at the $499 high. At $364.27 that slot has lost roughly 27 percent of its value, which is about 1.35 percent of the whole portfolio (5 percent times 27 percent). Painful, and survivable. Had the same holder put in 15 percent because the story felt compelling, the portfolio hit would be about 4 percent from that one name over the same stretch, and the temptation to sell near the low would be much stronger. I am not describing anyone’s trade. I am showing what the same price path does at two sizes.
If that same holder had used the divide-by-beta approach with a vendor beta somewhere around 2, the slot would have been 2.5 percent, and the loss on the same path about 0.7 percent of the portfolio. That is the kind of drawdown that lets you keep reading the earnings report calmly instead of refreshing the price. The point is not that Tesla is a bad stock. My earlier note on what the pessimism priced in covers the business case. This is only about how much of it to hold.
One more observation from the same data. Tesla’s analyst targets in the DB run from $130 to $505 with 24 analysts covering it, which is a spread of nearly four to one. When the people paid to model a company disagree that widely, I take that as a second, independent argument for a smaller slot. Beta measures how the stock trades against the market. A wide target range measures how much the professionals disagree about what the business is worth. Both point the same direction.
Why this beats a stop-loss
The usual alternative is to hold a large position and protect it with a stop. I have two objections. A stop converts a temporary drawdown into a permanent loss, and high-beta stocks are exactly the ones that gap through stop prices on bad days, so you do not even get the exit you planned. A stop of 15 percent that fills at 21 percent on a gap is a common experience, not a rare one.
Sizing works before the fact. If a position is small enough that a 40 percent fall costs you 1 percent of the account, you do not need to sell into panic. You can wait for the thesis to play out or fail on its own evidence. That is the real benefit: sizing buys you the option to be patient. A stop-loss, in contrast, sells you the option to be mechanical.
Compare that with Nvidia, which the DB shows around $222 with a 52-week low of $164 and a high of $236, a range of about 44 percent from bottom to top. My Nvidia analysis and the Nvidia and AMD comparison both argue for owning the company, and I still would not put it in the same slot size as a slow consumer staple. A 44 percent range in twelve months is what “high beta” looks like in practice.
Where the rule breaks
Beta tends to rise in a crisis. In calm markets a stock with a measured beta of 1.6 may behave like 1.6. In a panic, correlations climb, and the same stock can fall like a 2.2. Sizing to the measured beta therefore understates the real risk in the worst month, which is the month sizing exists for. I would add a margin of safety by using a beta about 20 percent higher than the reported figure for anything already above 2.
Second, beta only describes market-related risk. A company can lose 40 percent in a day on a failed trial, a fraud finding or a guidance cut, while the index barely moves. For those events, a single number will not save you. Only position size and diversification do. A holder with ten high-beta names that all depend on the same theme (say, AI capital spending) has one bet, not ten, and the divide-by-beta rule will not see that.
Third, the rule is silent on conviction. If I had real edge in one name, a case for sizing it above the grid would exist. I would want that case written down with numbers before I acted, and I would want it to survive a week of sleeping on it. Most of the time, the urge to oversize is not edge. It is excitement.
What would prove this approach wrong
Here is the counter-case. If a high-beta stock delivered market-beating returns after costs, on a small slot, for a full cycle, the small slot would have cost me money compared with a larger one. That is a real cost. A 2 percent position in a stock that triples adds 4 percent to the account. A 5 percent position adds 10. Over long stretches, undersizing winners is a tax you pay for surviving the losers.
I accept that trade because I cannot tell in advance which high-beta name will be the winner, and because the losers are far more expensive than the winners are profitable. The arithmetic of drawdowns is not symmetrical: a 50 percent fall needs a 100 percent gain to recover. Sizing to keep every fall inside a small band keeps that recovery arithmetic within reach.
I could be wrong about this if I found evidence that the stocks I care about mean-revert fast and reliably, so that the typical drawdown reverses within a few months. I have not found that evidence, and with names like Tesla, whose shares sit 27.0% below their high after a year, it looks doubtful.
The next number to check
Before you add to any position, look up its beta on two sources, take the higher one, and divide your base weight by it. If the result is under 1.5 percent, skip the stock or buy something with a lower number. If it is above your intended slot, do not upsize just because the math allows it. Then look at the same stock again after the next earnings report, since a change of more than 0.3 in the reported beta is a sign the business or its trading pattern has shifted.
Analysis and opinion only, not investment advice. Position sizing does not prevent losses; it limits how much any one of them can hurt. Figures come from Tesla’s filings on SEC EDGAR and Nvidia’s SEC filings with prices from market data dated September 18, 2026; betas and ranges are approximate and were checked on September 22, 2026.
Related Reading
 CVS
CVS
CVS Stock at 13.6 Times Forward Earnings: Is the Estimate Stale?
CVS Health trades at 23.4 times trailing earnings and 13.6 times forward earnings, and the raised 2026 guidanc…
 News
News
Target Stock: Traffic Is Up 3.6%, Margins Have Not Followed
Target's comparable traffic grew 3.6% last quarter and the stock has nearly doubled from its low. At 16.4 time…
 News
News
Five Footnotes I Read Before I Trust a Balance Sheet
A balance sheet shows totals; the notes show how they were built. Here are the five footnotes I open first, wh…