
Nvidia and AMD Side by Side: Growth, Price and Payout

Nvidia rose +8.7% the day after its last earnings report. AMD fell -7.0% after its own report three weeks earlier. Both companies grew revenue at rates that would have sounded made up five years ago, and the market rewarded one and punished the other. That split is the actual subject of this post, not the usual growth-rate scoreboard, and it holds a clue about which stock is more fully priced that a simple side-by-side of growth rates misses entirely.
I get asked which of these two to own more often than almost anything else in AI hardware, and my honest first answer is that people usually aren’t comparing what they think they’re comparing. Nvidia’s advantage isn’t just chips, it’s the software layer built on top of them over a decade, and AMD is still buying its way into that position one quarter at a time. Here’s how the two actually stack up after their latest results.
The sentence I’d lead with: Nvidia’s forward earnings multiple is now cheaper than AMD’s, 18.1 times against 58.6 times, even though Nvidia is roughly six times AMD’s revenue scale. That inversion, not the trailing P/E gap everyone quotes, is the number that should drive the choice between them.
Two earnings reactions that ran backward
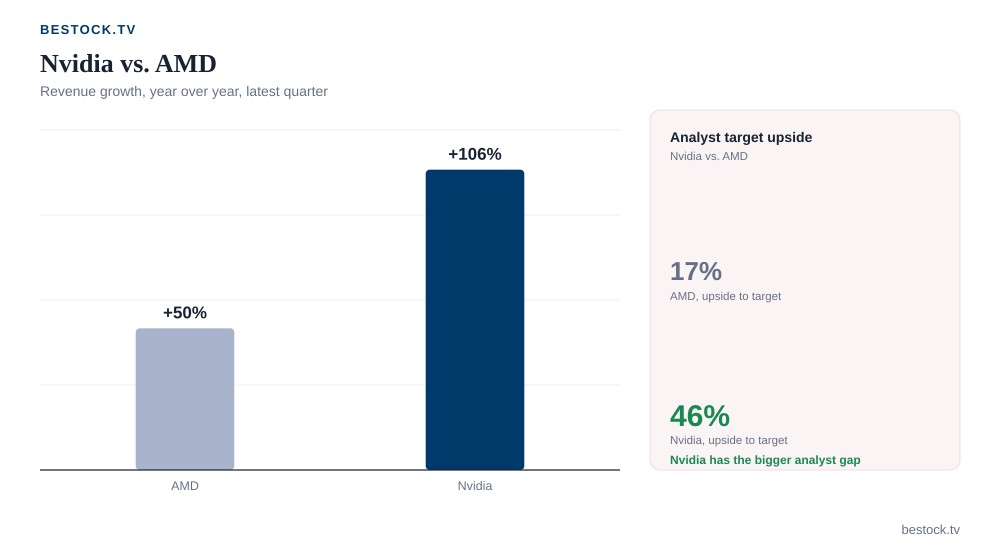
Nvidia’s most recent quarter, reported 2026-08-26, showed revenue of $96.2 billion, up 106% year over year and 18% sequentially. AMD’s quarter, reported 2026-08-04, showed revenue of $11.5 billion, up 50% year over year and 13% sequentially. On percentage growth alone AMD’s quarter reads as the more standard “beat,” yet its stock fell -7.0% while Nvidia’s rose +8.7%, more than its own average post-earnings move of 4.8%.
I read that as expectations doing the work numbers alone can’t. AMD’s average earnings-day swing is 11.4%, well above Nvidia’s 4.8%, which tells me the market treats AMD’s prints as higher-variance events even before it sees them. A 50% growth quarter from a company priced for acceleration can still disappoint the specific number a nervous market was braced for.
The scale gap behind both headlines
Annualize each company’s latest quarter and the gap gets clearer. Nvidia’s run rate is $384.9 billion, against AMD’s $46.1 billion, a difference of well over eight times. Nvidia’s market capitalization is $5,356.7 billion; AMD’s is $913.9 billion. Nvidia is defending a lead this large. AMD is trying to grow into a much smaller piece of the same trade, which is a fundamentally different kind of bet even when both stocks sit in the same sector conversation.
Revenue history makes the same point with more texture. Nvidia has gone from $27.0 billion in fiscal 2023 to $60.9 billion to $130.5 billion to $215.9 billion in fiscal 2026, a climb that’s roughly eight-fold in three years. AMD has moved from $23.6 billion in 2022 to $22.7 billion in 2023, essentially flat, before accelerating to $25.8 billion in 2024 and $34.6 billion last year. AMD’s growth is real. It’s also two years younger than Nvidia’s, which matters for how much of it the market has already paid for.
Where the multiples flip
Trailing P/E favors Nvidia by a wide margin: 28.1 times against AMD’s 143.5 times. That’s the number most comparisons stop at, and it’s misleading on its own, because Nvidia’s trailing earnings already reflect a year of extraordinary growth while AMD’s trailing earnings barely reflect its ramp at all.
Move to forward multiples and the picture inverts. Nvidia trades at 18.1 times forward earnings, well under its own five-year average of 72.7 times. AMD trades at 58.6 times forward earnings, above its five-year average of 51.4 times. Forward EPS growth implied is 55% for Nvidia and 145% for AMD, so AMD is priced for the faster percentage ramp, but at a multiple that’s already rich against its own history, while Nvidia is priced at a discount to its history despite carrying most of the market.
Price-to-sales tells a similar story: Nvidia at 17.7 times versus a five-year average of 26.1 times, actually cheaper than its own history; AMD at 20.4 times against a five-year average of 9.9 times, roughly double. For comparison, a company priced for consistency rather than growth, like Apple, carries nowhere near AMD’s multiple on either measure.
Price-to-book adds a third data point that agrees with the first two. Nvidia trades at 23.4 times book against a five-year average of 36.0 times, meaningfully below its own history. AMD trades at 12.5 times book against a five-year average of 6.8 times, meaningfully above it. Three separate multiples, all pointing the same direction, is a stronger signal than any one of them alone, and it’s why I don’t treat the trailing P/E gap as the last word on which stock is actually expensive right now.
What the quant scores are saying underneath
Nvidia’s quant rating has slipped to a C from a B. AMD’s has jumped to a A from a C. I wouldn’t trade off that alone, these scores move with recent price action as much as with fundamentals, but it’s a second signal pointing the same direction as the forward multiples: the market’s read on AMD has been improving faster than its read on Nvidia, even while Nvidia’s stock outperformed on earnings day.
Short interest sits at 1.2% of Nvidia’s float against 2.6% of AMD’s, more than double. Analyst coverage leans bullish on both, 100% buy ratings on Nvidia from 30 analysts against 85% on AMD from 33, but the average target tells a sharper story: Nvidia’s $324 average target sits 46% above today’s $222.27, while AMD’s $654 average sits only 17% above its $559.82. Wall Street, on average, sees more room left in the stock that already ran further this year.
Margin tells a quieter story than growth
Nvidia’s gross margin was 71.1% in its latest fiscal year, down from 75.0% the year before, a real compression even inside a growth story this large. AMD’s gross margin was 49.5%, essentially flat against 49.4% a year earlier. Nvidia still runs a far richer business: 60% operating margin and 56% net margin against AMD’s 11% and 13%. But the direction of travel matters as much as the level, and Nvidia’s is moving the wrong way while AMD’s has stabilized.
Net income growth captures the same divergence in dollars. Nvidia’s net income rose to $120.1 billion from $72.9 billion, up roughly two-thirds. AMD’s rose to $4.3 billion from $1.6 billion, nearly tripling off a much smaller base. Both are strong results in their own right. AMD’s is the one still compounding off a base small enough that the percentage gains can keep surprising for longer before the law of large numbers catches up, which is the honest case for owning the smaller name.
| Metric | Nvidia | AMD |
|---|---|---|
| Price | $222.27 | $559.82 |
| Market cap | $5,356.7 billion | $913.9 billion |
| Revenue, latest quarter | $96.2 billion (106% YoY) | $11.5 billion (50% YoY) |
| Gross margin | 71.1% | 49.5% |
| P/E (trailing) | 28.1 | 143.5 |
| P/E (forward) | 18.1 | 58.6 |
| Analyst target upside | 46% | 17% |
| Quant score (now vs prior) | C vs B | A vs C |
The dividend question neither one answers
Neither stock pays you much to wait. Nvidia’s dividend yield is 0.13% on a trailing $0.28 a share; AMD pays no meaningful yield at all by comparison, and its own capital return is closer to buyback-only. I’ve made the case elsewhere that a token yield like this isn’t a reason to buy or avoid a stock either way, it’s just not part of the return equation here. Whatever you make of these two, you’re underwriting growth and multiple, not income.
What would flip this comparison
The plainest risk to Nvidia’s side of this argument is that gross margin keeps sliding while a large customer or two decides to build its own chips instead of buying merchant silicon; if that shows up as a second straight year of margin decline, the discount-to-history multiple stops looking like a bargain and starts looking earned. The plainest risk to AMD’s side is the opposite: if data center growth decelerates from here before margins expand enough to justify 58.6 times forward earnings, the “priced for the ramp” argument breaks, and the stock has real room to reprice down toward its own five-year average.
Both companies depend on the same foundry to actually make these chips, and I’ve written about how much pricing power sits with that single supplier; a disruption there would hit both names at once and make this whole comparison moot for a quarter or two. Neither company controls that risk directly, which is worth remembering whenever the comparison gets framed as purely a contest of engineering roadmaps.
There’s also a simpler downside case for owning either one that has nothing to do with which company executes better: both stocks now depend on AI infrastructure spending staying high across the customers that buy from them. If that spending merely grows more slowly rather than shrinking outright, Nvidia’s premium business likely holds up better in relative terms than AMD’s, since AMD needs the newer, less-proven parts of its roadmap to keep landing on schedule to hit the multiple it already carries.
I own the view that Nvidia’s forward multiple is the more interesting number right now, not because AMD’s growth is fake, it isn’t, but because a market-leading business trading under its own five-year average multiple is a less common setup than a challenger trading above its own average while still proving the thesis. The next data point I’d weight most is Nvidia’s gross margin in the coming quarter: another leg down past 71.1% would cost this argument more than any single AMD earnings beat could add to the other side.
Analysis and opinion only, not investment advice. Figures come from NVIDIA‘s results on SEC EDGAR and AMD’s results on SEC EDGAR; valuation multiples are approximate and were checked on 2026-09-18.