
AMD’s Case Rests on Being the Second Source for AI Compute
Whenever I talk to someone about AI chips, the conversation turns into a conversation about Nvidia within about ninety seconds. That’s fair, since Nvidia has most of the market and most of the margin. But it also makes AMD easy to misjudge, because people keep asking whether AMD can beat Nvidia, and I don’t think that’s the question its shareholders should care about. The better question is smaller and much easier to test: do the biggest buyers of AI compute want a second supplier badly enough to keep paying for one? After the June quarter, I think the honest answer is yes, and there are numbers now instead of just slides.
A quarter that changes what the company is
AMD reported revenue of $11.54 billion, up 50% from a year earlier (see the segment detail on AMD’s financials page). The Data Center segment did the heavy lifting with $6.72 billion, up 107%, and $2.1 billion of operating income. It’s now 58% of the whole company. If that doesn’t sound like a big deal, remember that not long ago Data Center was a decent-sized business sitting next to a much bigger PC and gaming operation. Now the PC and gaming operation is the side dish.
The rest of the report is what you’d expect from a chip company in an uneven year. Client revenue grew 23% to $3.06 billion, helped by AI-capable PC chips, while gaming fell 31% to $779 million as the console cycle aged. Non-GAAP gross margin was 56% and non-GAAP EPS was $1.66. For the September quarter, AMD guided to roughly $13 billion, up about 41%, with margin holding near 56%.
I care about that mix more than any single line. When more than half of your revenue comes from a segment that’s doubling, the company you’re valuing isn’t the company that existed two years ago, and any multiple you remember from back then is out of date.
Why a buyer wants a second vendor
Here’s the argument in plain terms. If you’re Microsoft, Meta or a cloud provider spending tens of billions on accelerators, you’re negotiating with a supplier that has high margins and limited supply. Any credible alternative helps you at the table even before you buy much from it. You also don’t want one company’s allocation decisions to set your product roadmap. That’s not a technical argument. It’s just what every large buyer does with every large supplier.
AMD’s own list of named Instinct deployments now reads like a who’s who: Microsoft, Meta, OpenAI, Oracle, Anthropic and several smaller cloud players. The biggest single announcement is the Anthropic agreement for up to two gigawatts of MI450-series GPUs in AMD’s Helios racks. I keep coming back to the unit in that sentence. Gigawatts is a power figure, not a chip count, and it tells you how these deals are being sized now. Nobody negotiates in gigawatts for a pilot. A customer that commits that way is planning around you.
The part of the market that’s actually open
Training a frontier model leans hard on Nvidia’s CUDA software, and that’s the moat everyone talks about. Inference, which is where most of the compute spending will end up over the long run, cares a lot less. What inference cares about is memory. How much fits on a chip, how fast it moves, what it costs to serve a token. Memory capacity is where AMD has been competing hardest, and it’s the reason I think the second-source argument is strongest there.
AMD says Helios and MI450 begin to ramp in the second half of 2026, so the next couple of quarters are the audition. A roadmap slide costs nothing. A rack that ships on schedule and runs a customer’s workload is another matter, and I’d be more impressed by two clean quarters of shipments than by another partnership announcement.
The boring half that pays for it
It’s easy to forget that AMD’s server CPUs are a good business by themselves. Epyc processors have taken a large slice of the x86 server market from Intel since 2020, and the profit from that side of the company is steadier than anything happening with accelerators. It’s part of what lets AMD fund the AI push without borrowing against it. If the accelerator story hit a wall tomorrow, the server CPU business would still be there. Most of the people who talk about AMD as a pure AI bet ignore this, and I think it’s a mistake in both directions. It lowers the downside a bit, and it also means part of what you’re paying for isn’t the AI story at all.
Where it could go wrong
The constraints are the same ones everyone in this industry faces, plus a couple that are specific to AMD. Advanced packaging capacity at TSMC limits how many accelerators anyone can build, so AMD’s growth depends partly on how much of that capacity it can get. Software is a real drag: customers have to port and tune code for AMD’s stack, and that work is slow no matter what a benchmark says. Customer concentration means a handful of buyers place orders that arrive in lumps, so one quarter can swing on a single delivery schedule.
And gaming, down 31%, is a reminder that not every segment moves with AI. I wouldn’t lose sleep over it, but it does show up in the total.
There’s also the comparison nobody in AMD’s corner likes to make. Nvidia’s Data Center segment is roughly thirteen times the size of AMD’s, a gap I sized up directly in Nvidia and AMD side by side. Being the second source to a company that big is still a good place to be, but it’s a smaller prize than the marketing sometimes implies.
Selling racks changes the business
There’s a shift inside those numbers that’s easy to overlook. The MI450 generation isn’t sold as a card you slot into someone else’s server. It ships inside Helios, a full rack that AMD designs, and AMD bought a rack-design company, ZT Systems, in 2025 to be able to do that. If you’re a customer, that’s attractive, because you get something you can plug in and turn on. If you’re an investor, it changes what the income statement looks like. Revenue per deal goes up a lot, since you’re selling the whole rack, but gross margin per dollar generally goes down, since a rack includes a lot of parts AMD doesn’t make and can’t mark up like a chip.
That’s why I keep an eye on the 56% margin. Holding it while the mix moves toward systems would be a real accomplishment. Watching it drift to the low 50s wouldn’t be a disaster, but it would tell you that growth is being bought with a thinner slice of each sale. And I’d note that the company hasn’t said much about how it expects that trade to play out. It’s the kind of thing that gets clearer a few quarters after the racks ship, not before.
How the big deals are structured
I’d also be a bit careful about reading every big announcement as pure demand. When OpenAI agreed last fall to a multi-gigawatt commitment with AMD, part of the arrangement involved warrants that let OpenAI buy AMD shares if certain milestones were hit. I don’t think that makes the demand fake, and I’m not suggesting anything shady. But it does mean the customer is being given a reason to follow through, and that’s worth remembering the next time a very large number shows up in a press release. A customer who’s incentivized to deploy is a different thing from a customer who simply needs the product. Both can be true at once. It’s just useful to know which one you’re looking at.
The same goes for the concentration issue I mentioned. If a small number of AI labs and cloud providers account for most of the growth, then AMD’s results start to look like a bet on those particular companies’ budgets. Those budgets are enormous right now. They aren’t guaranteed to stay that way.
Price and multiple, checked today
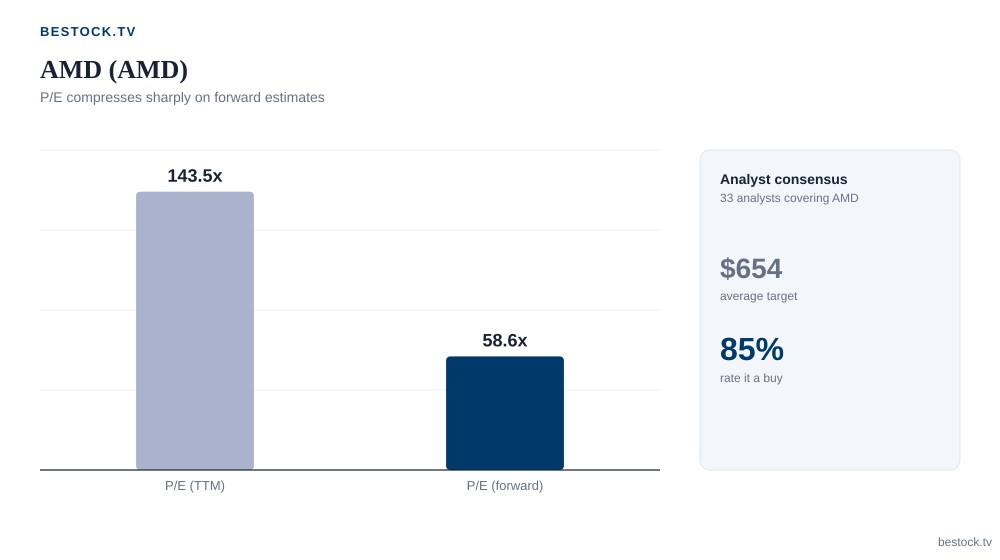
The stock has moved a long way since that print. Shares trade around $559.82 as I write this, 4.3% below the 52-week high and 262% above the 52-week low, which puts the market’s verdict on the quarter in plain view (current multiples are on AMD’s valuation page). At 143.5 times trailing earnings the multiple already assumes the growth in Data Center keeps compounding; the forward multiple of 58.6 implies analysts expect earnings to climb roughly 145% from here. That’s a demanding bar, not a modest one.
| Metric | Value | Context |
|---|---|---|
| Price | $559.82 | 52-week range $155 to $585 |
| Market cap | $913.9 billion | |
| P/E (TTM) | 143.5 | five-year average 51.4 |
| P/E (forward) | 58.6 | implies EPS growth of 145% |
| Average analyst target | $654 | 85% rate it a buy, of 33 analysts |
What I’d watch
Three things, all checkable in filings. Whether Data Center revenue keeps growing from quarter to quarter as MI450 volume begins. Whether gross margin holds near 56% as the mix shifts toward rack-scale systems, which usually earn less than standalone chips. And whether new deployments get named with a power or unit figure attached, because vague announcements are cheap and specific ones aren’t.
My read is that this quarter moved the second-source argument from plausible to paid for. It hasn’t proven AMD can match Nvidia, and it doesn’t need to. It needs to keep winning enough of the incremental spending that buyers refuse to let one vendor set the price. If MI450 slips, or margin sags as racks ramp, that argument weakens quickly and the multiple will notice before the fundamentals do. I’d rather watch that play out than guess at it.
One last thing I’d say to anyone new to the stock. AMD has been a disappointing holding often enough that it’s tempting to assume every good quarter will be followed by a stumble. I understand the instinct, and I’ve had it. But the pattern I see now is different from earlier cycles, where a strong quarter came from a single product doing well. This time revenue is broad: server CPUs, PC chips, accelerators and networking all contributed, and only one segment (gaming) went the wrong way. That’s a healthier base to build on than what the company has had before, and it’s why I’d give the recent numbers more weight than a typical AMD beat.
Analysis and opinion only, not investment advice. Figures come from AMD’s second-quarter 2026 results release and its filings on SEC EDGAR; valuation multiples are approximate and were checked on September 23, 2026.