
Verizon’s 5.9% Yield: What the Payout Ratio Actually Says
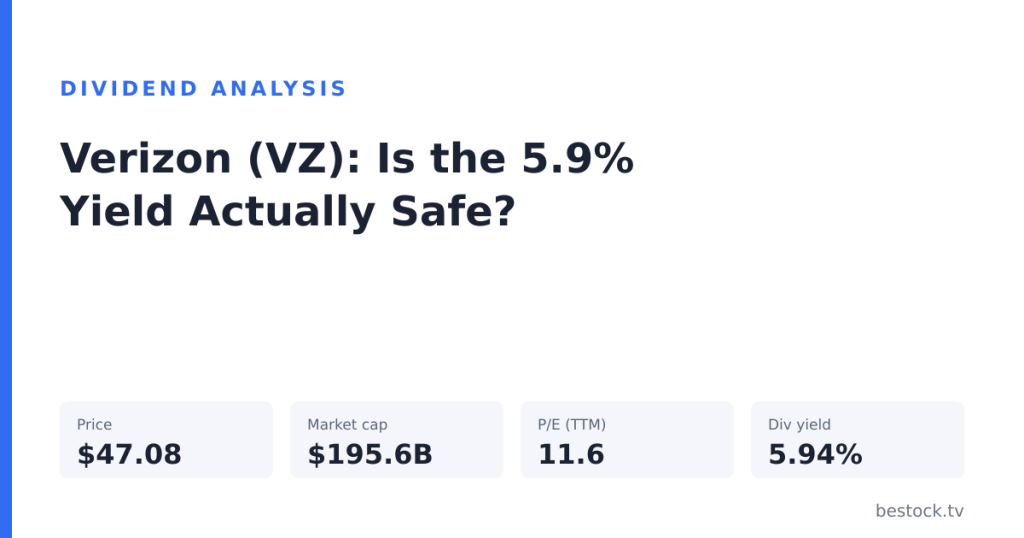
Verizon trades at $47.08 a share, 11.6 times trailing earnings, and yields 5.94% as of my last check on the quote data I use for these posts. Market cap runs about $195.6 billion, comfortably inside mega-cap territory even though the stock behaves nothing like one. Numbers like that usually mean one of two things. Either the market has mispriced a slow, cash-heavy business it finds boring, or everyone already expects a dividend cut and the price has adjusted for it ahead of time.
I’ve looked at plenty of names yielding 6% or better, and most of the time the payout ratio built off adjusted earnings tells you almost nothing about whether the cash is actually there to keep paying it. I laid out that general problem in a piece on durable dividend income, and Verizon is close to a textbook case for testing it: heavy annual capital spending, a debt load built up over a decade of spectrum auctions, and a stock price that hasn’t moved much in years.
Wireless service revenue is still the bulk of what Verizon books every quarter, and that’s the piece the subscriber numbers further down actually measure. Broadband and business services matter too, but phones are where the churn story either holds up or falls apart.
Here’s where I land after running the actual cash numbers instead of the ratio most screens show. Verizon’s free cash flow covered its first-half 2026 dividend with a real cushion left over, net debt fell for a second straight quarter, and postpaid phone subscribers stopped shrinking for the first time in years. None of that makes VZ a growth stock, and I want to be upfront about that limit. It does make the 5.9% yield look earned against this year’s cash flow rather than borrowed against next year’s, a different conclusion than the trailing multiple alone would suggest. I pulled these figures from Verizon’s financials page, which updates each quarter.
Free cash flow beat the dividend
Verizon generated $6.4 billion of free cash flow in the second quarter of 2026, up 24.4% from a year earlier, according to the company’s own results release. First-half free cash flow came to $10.2 billion, against $8.8 billion in the first half of 2025, a 16% increase. Dividends paid over that same first half ran $5.9 billion, with another $3.5 billion going to share buybacks, for $9.4 billion in total shareholder returns, up more than 60% year over year. Divide the dividend figure into the free cash flow number and the payout ratio comes out to 57.8%, a calculation Verizon doesn’t publish itself. That’s a meaningfully wider cushion than the adjusted-earnings payout ratio most screens show for this stock. Trailing EPS works out to roughly $4.06 once I back it out of the price and the 11.6 P/E, which puts the same $2.83 annual dividend rate at a 69.7% payout ratio against earnings instead of cash, a bit above the 5.94% trailing yield in the snapshot since that figure still reflects part of the year at the old, lower payment.
The gap between those two ratios, 57.8% on cash against 69.7% on earnings, is mostly depreciation. A capital-intensive network business books large non-cash charges that lower reported income without touching the cash actually available to fund a dividend. I’d trust the cash-based number more for a company spending this much every year on fiber and 5G buildout.
Net debt inched in the right direction
Net unsecured debt stood at $128.7 billion at the end of the second quarter of 2026, down from $130.1 billion three months earlier, a decline of $1.4 billion. Net debt against consolidated adjusted EBITDA sits at 2.5 times, a level management has described as inside its target range for a while now.
One quarter of debt reduction isn’t a trend I’d hang the whole thesis on. I don’t have a clean multi-year run of this specific net-unsecured-debt figure in front of me to say whether $1.4 billion is a real inflection or ordinary quarter-to-quarter noise, so I’m treating it as a mildly encouraging data point rather than proof the balance sheet has turned a corner.
Most of that debt traces back to spectrum Verizon bought years ago to build out its mid-band 5G network, a one-time expense that still sits on the balance sheet long after the buildout itself. A 2.5 times ratio holding steady between auctions is a different signal than the same ratio right after a big purchase, and the direction matters here more than the raw dollar figure does.
Postpaid phones stopped bleeding subscribers
The recurring bear case on Verizon for years has been subscriber losses to cheaper prepaid plans and cable-bundled wireless, particularly the mobile plans cable companies sell alongside broadband. That case took a real hit this summer. Verizon added 184,000 postpaid phone subscribers in the second quarter of 2026, an improvement of 193,000 from the year-earlier quarter, which means the comparable period a year ago was essentially flat to slightly negative. Consumer postpaid phone net adds were the best for any second quarter in five years, and management raised full-year guidance to the upper half of a 750,000-to-1-million-subscriber range.
That’s a real reversal. It isn’t a growth story.
A small raise, a twenty-year streak
Verizon raised its quarterly dividend by 2.5% in September 2026, to $0.7075 a share, or $2.83 annualized. That continued a long, unbroken run of annual increases, the kind of streak that matters for any large-cap stock, let alone one carrying this much debt. It is also, by any honest reading, a token raise: 2.5% barely keeps pace with inflation, and it trails the rate at which free cash flow grew this year by a wide margin.
I covered this exact pattern in a separate piece on 6% payers that grow the dividend slower than almost everything else in a portfolio, and Verizon fits that mold closely. The yield is the return here. Payout growth itself isn’t going to move total return the way it might with a stock raising its dividend 8% or 10% a year.
The table below lines up the screen-level numbers against the ones I just walked through, so the gap between the two is easy to see in one place.
| Metric | Verizon figure | Context |
|---|---|---|
| Price | $47.08 | as of my last check |
| Trailing P/E | 11.6x | below most large telecom peers |
| Dividend yield (TTM) | 5.94% | implies roughly $2.80/share trailing |
| FCF payout ratio (H1 2026) | 57.8% | my calculation: $5.9B dividends / $10.2B FCF |
| EPS payout ratio (TTM) | 69.7% | my calculation: $2.83 / ~$4.06 implied EPS |
| Net unsecured debt | $128.7B | down from $130.1B the prior quarter |
| Net debt / adj. EBITDA | 2.5x | inside management’s stated target |
| Postpaid phone net adds (Q2 2026) | 184,000 | best consumer Q2 in five years |
Where this argument breaks
Every row in that table assumes the current run holds. The clearest way I’d be wrong here is a fresh capital spending wave. Verizon’s network investment has run in multi-year cycles before, and a new spending push would eat directly into the free cash flow currently covering the dividend with room to spare. I don’t have visibility into Verizon’s multi-year capex plan beyond current guidance, so I can’t rule this out, and it’s the one thing that would send me back to reconsider this whole argument.
There’s also a version of the bear case that doesn’t need a capex shock at all. If this quarter’s postpaid gains turn out to be promotional pull-forward rather than a durable shift, the subscriber story reverses again next year, and the market goes back to pricing VZ like a business in slow decline. That would weaken the thesis without necessarily breaking it, since the dividend math would still hold for a while even with subscriber growth stalling out again. I’d treat two more quarters of positive postpaid phone net adds as the threshold that turns this from an encouraging data point into an actual trend.
None of this makes Verizon exciting, and I’m not pretending otherwise. What it does is answer the specific question a bare P/E and a bare yield can’t: does the cash exist to keep paying this dividend without borrowing against the future to do it. Right now the free cash flow says yes, with room to spare, and the subscriber trend says the worst of the bleeding has stopped. If net debt keeps declining and postpaid phone net adds hold above 150,000 a quarter through the back half of this year, I’d call the 5.9% yield safe income rather than a slow-motion problem. If either number reverses, the calculus changes fast.
Analysis and opinion only, not investment advice. Figures come from Verizon’s second-quarter 2026 results release and its own investor disclosures; the free cash flow payout ratio and the earnings-based payout ratio are my own calculations, and price, P/E, yield, and market cap are approximate as of my last check on September 26, 2026.