Best Dividend Stocks to Buy Now for Real, Durable Income
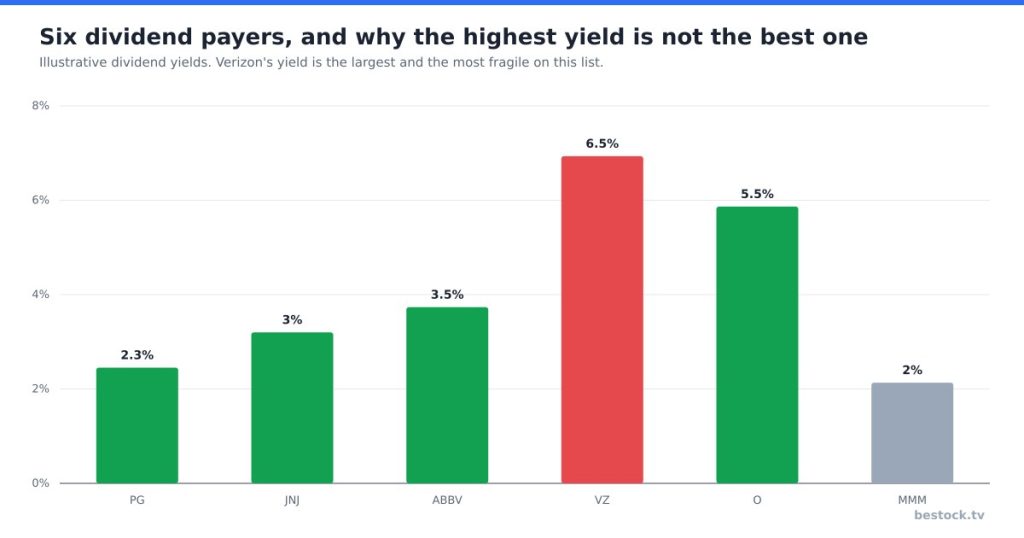
Verizon yields 5.81% right now. 3M yields 1.82%, barely above the S&P average. If you only looked at those two numbers, you would buy Verizon and ignore 3M. But 3M is the company that slashed its dividend by 53.6% in 2024, ending a 64-year streak of annual increases, and Verizon has not touched its payout in years. The yield tells you almost nothing about which check is actually safer to keep collecting.
That gap is the whole argument for this list. A high yield usually means the market has already priced in some risk to the payout, and a modest yield with a long track record usually means the opposite. I put together six dividend payers I would actually hold for income, and I sized up each one on the same question: not how big is the yield, but how much room does the company have before that yield becomes a problem.
My thesis: durability comes from the ratio between what a company pays out and what it can actually spare, not from the number printed on a stock screener, and by that measure this list runs from clearly durable (Procter & Gamble) to recently reset and arguably safer for it (3M), with the other four landing somewhere in between.
Procter & Gamble pays out less than it earns
Procter & Gamble trades around $146.39, at 22.1 times trailing earnings, below its own five-year average of 25.3. The dividend yield is 2.91% on $4.26 paid annually, modest next to Verizon or Realty Income, and that modesty is the point. A company that pays out roughly half its earnings, the way Procter & Gamble does, has room left over for the input-cost spikes and weak-volume quarters that eventually hit every consumer staples company. Revenue growth is only 3% year over year, unglamorous by any measure, but a brand portfolio that includes Tide, Pampers, and Gillette does not need fast growth to keep raising a dividend that analysts, on average, still see climbing toward $161 a share.
Johnson & Johnson spreads the risk across two businesses
Johnson & Johnson trades near $269.99, at 31.3 times earnings, above its five-year average of 21.9, with revenue growth running 6%. Since spinning off its consumer health unit into Kenvue, the company is now built from pharmaceuticals and medical devices, two businesses that do not move together. A bad year in oncology drug pricing does not automatically mean a bad year in surgical devices, and that lack of correlation is worth more to a dividend holder than either business’s individual growth rate. The company still carries real litigation risk, most notably from talc-related claims working through the courts, and I would not pretend that overhang is priced to zero. It is a cost of owning the stock, not a reason to avoid the dividend entirely, given the 1.94% yield sits on top of a business generating cash across two separate, non-correlated franchises.
AbbVie’s patent cliff is already in the rearview
AbbVie is the name on this list that looks the most expensive on paper, at 74.6 times earnings against a five-year average of 58.7, and the reason is that the market has moved on from the Humira patent cliff faster than the stock’s history suggests it should have. Humira lost U.S. patent exclusivity in 2023, and biosimilar competition has been cutting into its sales every quarter since; AbbVie’s own fourth-quarter results release shows the replacement drugs, Skyrizi and Rinvoq, now running at a combined pace of roughly $34.5 billion for 2026, more than covering what Humira used to contribute at its peak. That is the patent cliff most investors feared two years ago, already absorbed, with revenue growth still at 9% and the dividend yield at 2.55%. I would not call the stock cheap at this multiple. I would call the multiple earned.
Verizon’s yield still reflects real balance-sheet risk
Verizon trades around $48.09, at 12.5 times earnings, close to its own five-year average of 10.6, with a 5.81% yield that is the highest on this list by a wide margin. That yield is not free money. Verizon carries a debt load built up over years of spectrum auctions and network buildouts, and revenue growth of 3% is barely keeping pace with inflation, which leaves less cushion than Procter & Gamble or Johnson & Johnson have if the business hits a rough patch. I laid out the broader case for weighing yield size against growth durability in my dividend growth versus high yield piece, and Verizon is close to the textbook example: a payout that is currently covered, sitting on a balance sheet with less room to absorb a bad year than the lower-yielding names on this list.
Realty Income resets its promise every single month
Realty Income does not report a trailing P/E the way an operating company does, since it is a real estate investment trust that has to distribute most of its taxable income by law, so the more useful number is the payout ratio against adjusted funds from operations rather than earnings. On that basis, an independent dividend scorecard published in September put Realty Income’s AFFO payout ratio near 73%, a level considered conservative for a mature net-lease REIT, with an annualized dividend near $3.25 a share and a yield in the high 5% range. The company made its 674th consecutive monthly dividend payment on September 15, a streak that matters more to how I would size this position than the yield itself: it is evidence of an operating discipline built specifically around never missing that monthly date, across multiple rate cycles and a pandemic. The risk here is concentration in retail and office-adjacent tenants if consumer spending weakens broadly, which is the specific scenario that would make me trim rather than add.
Realty Income’s tenant list matters more than its ticker. The company leases to convenience stores, drugstores, grocery chains, and dollar stores, the categories of retail least likely to disappear in an online-shopping shift because they sell things people buy on the way home rather than order ahead of time. That is a different risk profile from a REIT built around enclosed malls or big-box department stores, and it is the reason the payout has survived multiple retail downturns without a monthly check getting skipped. A dividend that has never missed a month since the 1990s does not guarantee the next one arrives on schedule, yet it is the longest continuous track record on this list by a wide margin, longer even than Procter & Gamble’s raise streak, and that history counts for something when the yield alone would otherwise put this stock in the same bucket as much riskier income names.
3M’s dividend cut turned out to be the healthy move
3M is the name that belongs on this list precisely because of what happened in 2024, not despite it. The company had raised its dividend annually for 64 straight years, a Dividend King by any definition, and then cut the payout by 53.6% following the spin-off of its health care division into Solventum. 3M’s own announcement of the completed spin-off framed the reset around a lower payout ratio, closer to 40% of adjusted free cash flow versus more than 60% before, at a company that also faced more than $18 billion combined in PFAS and combat-arms earplug litigation settlements stretching out over the next decade. The stock’s current yield of 1.82% looks unimpressive next to Verizon’s, and that is exactly why I would trust it more. A dividend reset around a payout the company can actually sustain, with major legal liabilities already reflected in the settlement terms rather than hanging as an open question, is a more durable starting point than a payout that has not yet been tested against those same liabilities. 3M trades at 29.5 times earnings now, well above its 12.5 five-year average, which tells me the market has already started rewarding the reset rather than punishing it.
| Company | Price | Yield | P/E (TTM) | P/E vs. 5-yr avg |
|---|---|---|---|---|
| Procter & Gamble | $146.39 | 2.91% | 22.1 | 25.3 |
| Johnson & Johnson | $269.99 | 1.94% | 31.3 | 21.9 |
| AbbVie | $263.96 | 2.55% | 74.6 | 58.7 |
| Verizon | $48.09 | 5.81% | 12.5 | 10.6 |
| Realty Income | ~$66 | ~5.7% | n/a (REIT, AFFO basis) | n/a |
| 3M | $165.89 | 1.82% | 29.5 | 12.5 |
None of these six is risk-free, and the honest uncertainty in this list is timing: a recession that hits consumer spending broadly would pressure Realty Income’s tenant base and Verizon’s already-thin cushion before it touched Procter & Gamble or AbbVie’s newer growth drivers. If I am wrong about anything here, it is likely to be underestimating how correlated Realty Income and Verizon become in a real downturn, since both depend on steady, unglamorous cash flows that assume the consumer keeps paying its bills on time. Rate direction matters too, in the way I discussed when looking at bank deposit costs after the recent rate-cut cycle: REITs and telecoms with real debt loads benefit when rates fall and get squeezed when they do not.
The number I would watch next is 3M’s dividend coverage in its next full-year report, specifically whether the payout ratio stays near the 40% of free cash flow management promised at the reset. Hold near that level for another year, and the case that the cut fixed rather than weakened the stock gets stronger. Drift back above 55%, and the market’s patience with the new, lower yield should not be assumed.
Analysis and opinion only, not investment advice. Figures come from company filings on SEC EDGAR and each company’s investor relations site; valuation multiples are approximate and were checked on September 18, 2026.
Related Reading
 HD
HD
Home Depot (HD): Acquisitions Drive Growth as Comps Rise 1.7%
Home Depot grew sales 5.7% last quarter, but comparable sales rose only 1.7% and GMS supplied $1.4 billion of …
 CVS
CVS
CVS Stock at 13.6 Times Forward Earnings: Is the Estimate Stale?
CVS Health trades at 23.4 times trailing earnings and 13.6 times forward earnings, and the raised 2026 guidanc…
 News
News
Target Stock: Traffic Is Up 3.6%, Margins Have Not Followed
Target's comparable traffic grew 3.6% last quarter and the stock has nearly doubled from its low. At 16.4 time…