
SpaceX (SPCX) After a 53% Drop: How I Would Judge This IPO

SpaceX priced at $135, closed its first day near $161, touched $225.64 within days, and then gave back 53% to $104.83 before the market decided it might be worth owning after all. That sequence is worth studying even if you never touch the stock, because a hot IPO followed by a deep drawdown is one of the few situations where price, sentiment and fundamentals all tell different stories at the same time.
I do not own SpaceX and I am not going to pretend a trade to make this more dramatic. What I can do is lay out the public numbers, say what they support, and describe what I would need to see before I treated a drawdown like this as an opportunity instead of a warning. My thesis is simple: the post-IPO fall priced the excitement out of the stock, but it has not yet priced in whether the AI spending inside the company will earn its keep, and that second question decides the next move.
The price path in plain numbers
The facts come from press coverage of the listing. According to CNBC, SpaceX priced its shares at $135 on June 11 and began trading on June 12, 2026. The first session closed around $161, a gain of roughly 19%. A high of $225.64 followed within days. The low so far is $104.83, which puts the peak-to-trough drop at about 53%.
Then the stock recovered. CNBC reported on August 10 that shares closed back above the $135 IPO price for the first time in weeks. A market data snapshot I saw for September 21 showed the stock near $153, which is about 46% above the low, about 13% above the offer price, and still about 32% below the peak. Prices move daily, so treat those as a sketch of the shape rather than a quote.
Who owns the stock at each of those levels matters. Someone who received an allocation at $135 is sitting on a modest gain and has lived through a round trip. A buyer at the first-day close near $161 is underwater today. The person who bought the $225 spike is down about a third and probably has opinions about the underwriters. Same company, same day, three different experiences, and that gap is why I distrust any post-IPO story that leans on a single price.
What the first earnings report showed
The first report after the listing arrived on August 4. Per CNBC’s live blog, second-quarter revenue was $7.81 billion against about $6.93 billion expected, a beat of roughly 13%, and a 92% jump from a year earlier. The company posted a loss of 9 cents a share, better than the 26 cent loss analysts had modeled. The full release is filed as an 8-K on SEC EDGAR.
Beat on revenue, beat on the loss, and the stock still fell. CNBC’s takeaway headline says why: soaring AI costs outweighed the revenue beat. That is the tension in one line. Investors were paying for a rocket and satellite company and found that a third of the revenue now comes from an AI segment that is spending heavily.
I would rather look at the composition than the headline, so here is what the segments reported.
| Segment | Q2 revenue | Share of total | Versus expectation |
|---|---|---|---|
| Connectivity (Starlink) | $4.29 billion | about 55% | $3.83 billion |
| AI | $2.56 billion | about 33% | $2.18 billion |
| Space (launch) | $962 million | about 12% | $835 million |
| Total | $7.81 billion | 100% | $6.93 billion |
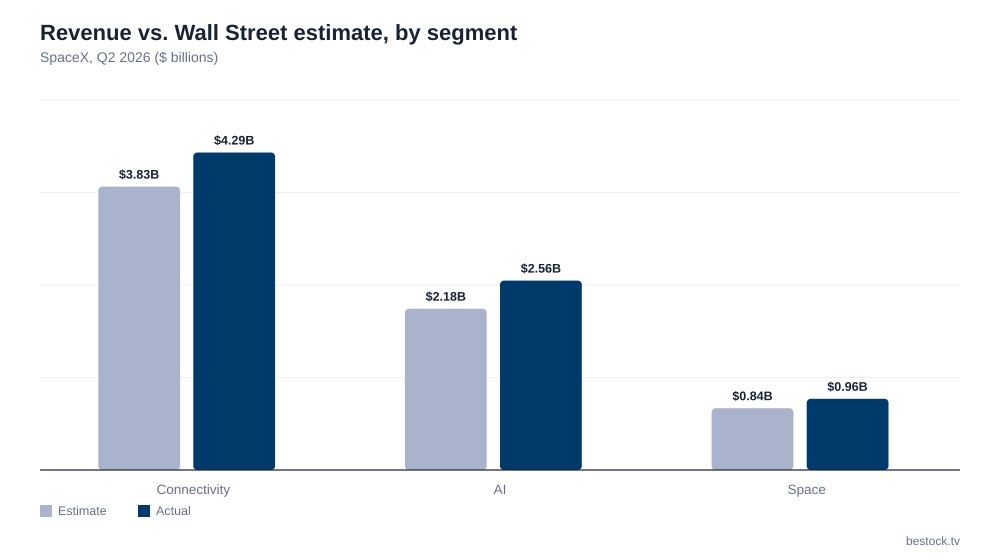
Every segment beat. That is the fact bulls will quote, and it is a real one. Beating in all three lines at once suggests the estimates were too low across the board, not that one lucky segment carried the quarter.
Starlink is the part I can underwrite
Connectivity is where the evidence is cleanest. Starlink reported 12 million subscribers, double the count a year earlier and up 17% from the first quarter. The segment earned $1.66 billion of operating income on $4.29 billion of revenue, a margin near 39%. A business that adds subscribers this quickly and already earns a 39% operating margin does not need a story.
Now the wrinkle. Average revenue per user was $66, flat with the prior quarter and well below the $85 of a year earlier. That is a drop of about 22%. Growth in subscribers is coming with cheaper plans and lower-priced markets, which is normal for a network that expands past its early adopters. It also means revenue growth from Starlink depends on adding people faster than the average price falls. I read the ARPU line as the number to watch each quarter. If it stabilizes near $66 while subscribers keep compounding, the Connectivity story holds. If it keeps sliding toward the $50s, the subscriber growth starts to buy less each quarter.
For a comparison of how the market treats a growth franchise after a reset, see my note on Tesla in early 2025 covers the case where pessimism priced in more than the business deserved. The lesson there was that a low price only helps if the earnings power underneath is intact. Here I think that is true of Starlink, and unproven for the rest.
The AI segment is the open question
Two and a half billion dollars of quarterly revenue is a large number for a segment the market barely discussed at the IPO. It is also the source of the cost pressure that the CNBC headline points at. I cannot see the segment margins from the public coverage I checked, and I will not guess at them. What I can say is that an AI business at this scale usually consumes capital faster than it returns it in the early years, and that public investors have been unforgiving about that trade. I made a similar argument about a far more mature company in my piece on Palantir’s growth and valuation problem: high growth buys patience, but not unlimited patience.
The CFO said on the earnings call that the company is on pace to reach $100 billion in annualized recurring revenue by the end of the year. Second-quarter revenue times four is about $31 billion, so that target implies a very steep climb in a few months, or a definition of recurring revenue that is broader than reported revenue. I do not know which, and the coverage I read does not settle it. Until the company spells out how that figure is built, I would not use it in a valuation. A claim I cannot reconcile to the quarterly line is a reason to ask a question, not a reason to add to a position.
Why lockups matter for the chart
Part of the post-IPO drop is mechanical. CNBC noted in July that the earnings date was tied to the first big share unlock. When early holders become free to sell, supply rises regardless of what the business is doing. I cannot attribute a specific share of the decline to that, and nobody outside the trading desks can. But I would expect a stock that lost more than half its value in seven weeks to have had forced and semi-forced sellers in the mix, which is a different situation from investors changing their minds about the company.
That distinction is the reason a drawdown alone is not a buy signal. A 53% fall could mean the market found a real problem, or it could mean a crowded first-day allocation was being unwound. The two look identical on a chart. They look different in the filings, which is where I would spend the time.
What would make me buy, and what would make me wrong
I would want three things before I called this stock attractive. First, Starlink ARPU holding at or above $66 for two more quarters while subscribers keep growing at double digits sequentially. Second, the AI segment reporting a margin, or a clear path to one, in the next filing. Third, a valuation I can compute from a share count and a market cap that I have checked myself, not one quoted secondhand. I did not verify a current market capitalization for this post, so I am deliberately not giving a multiple.
The counter-case is concrete. If Connectivity operating margin falls below 30% while AI losses widen, my read that Starlink can fund the rest of the company is wrong, and the stock deserves the discount it briefly had. The stock could also keep rising for reasons that have nothing to do with my checklist. Sentiment around space and AI names can carry a price a long way past what the numbers justify, and I hold that uncertainty openly. Two months of trading history is not a base rate for anything.
Trading a new listing, in general
A few habits apply to any IPO in this state. Do not anchor on the offer price, because it was set by bankers and the first-day pop already told you the bankers underpriced it or the crowd overpaid. Do not treat the all-time high as fair value, since it was set in four sessions by people who had no filings to read. Size the position as if the next unlock or the next quarter could take another 30% off, because the last one nearly took 53%. And check the ownership of the float, since a stock where insiders are still restricted trades differently from one where they are free.
The setup I find most interesting is the one we are in now: a stock that has recovered above its offer price, with one clean earnings beat behind it and a large question mark on AI economics ahead. The next report will show whether ARPU stabilizes and whether the AI line starts to look like a business. For me, the number to watch is that Connectivity margin against the 30% line, with ARPU at $66 as the second check.
Analysis and opinion only, not investment advice. Figures come from press coverage by CNBC and NPR, and the company’s 8-K on SEC EDGAR; price levels are approximate and were checked on September 22, 2026.
Sources: Price-to-earnings ratio (SEC Investor.gov glossary) (https://www.investor.gov/introduction-investing/investing-basics/glossary/price-earnings-pe-ratio) · How to read a company's 10-K (SEC Investor.gov) (https://www.investor.gov/introduction-investing/investing-basics/glossary/10-k)