
Exxon Mobil (XOM): Net Income Doubled, but the ‘Historical Average’ Is Misleading
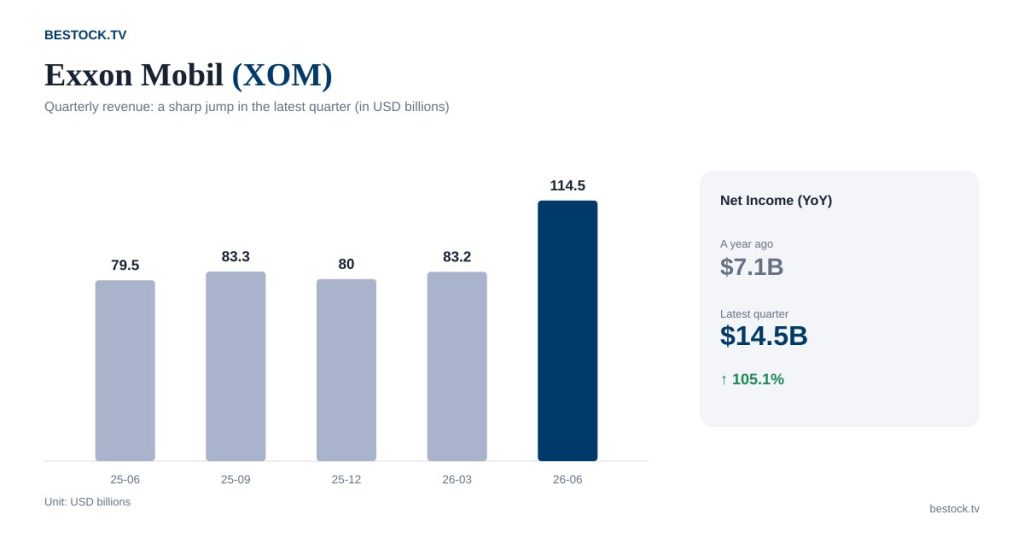
Exxon Mobil just posted a quarter where net income more than doubled year over year, and the stock’s own P/E percentile says it’s sitting near the most expensive point in its history. Those two facts sound like they contradict each other. They don’t, and the reason why is the whole point of this piece: with energy stocks, the “historical average” you’re comparing against can be a mirage if it was built during a few years nobody wants to repeat.
The Dividend Isn’t the Question
Exxon has raised its dividend for more than 40 consecutive years, through oil crashes that took the stock down 50% and more. At a 2.28% yield with $4.00 paid out over the trailing year, the payout here isn’t what keeps me up at night. What I want to work through is whether the valuation has gotten ahead of a commodity business that, by its nature, doesn’t deserve a growth-stock multiple no matter how good one quarter looks.
One Quarter Did a Lot of Heavy Lifting
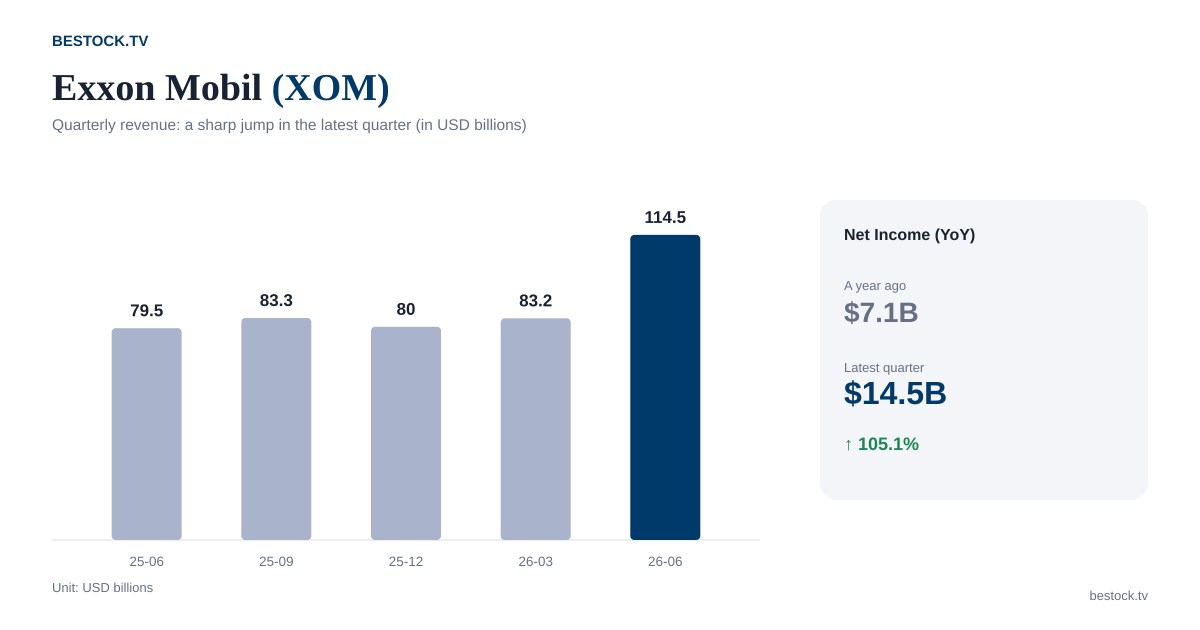
Revenue over the last five quarters: $79.5 billion, $83.3 billion, $80.0 billion, $83.2 billion, and then $114.5 billion in the most recent print, up 44.1% year over year. Net income followed the same pattern, jumping to $14.5 billion from $7.1 billion a year earlier, a 105% increase. That’s not a steady climb, it’s a step change, and step changes in an oil major’s results usually trace back to either a sharp move in crude prices or a large asset sale showing up in the numbers. I haven’t pulled apart which one did more of the work this quarter, and I’d rather say that plainly than pretend I’ve reverse-engineered the segment data.
The Three-Year Decline This Quarter Interrupted
Annual revenue tells the fuller story: $398.7 billion in 2022, the peak year of the post-pandemic energy price spike, falling to $334.7 billion in 2023, essentially flat at $339.2 billion in 2024, then down again to $323.9 billion in 2025. Net income followed an even steeper slide, from $55.7 billion in 2022 down to $36.0 billion in 2023, $33.7 billion in 2024, and $28.8 billion in 2025, a fourth straight year of decline heading into the quarter I just described. Gross margin tracked the same direction, from 25.9% in 2022 down to 22.0% by 2025.
That’s the actual source of the distorted valuation average I flagged earlier: three years of declining earnings on top of the 2022 spike have dragged Exxon’s trailing multiple history into a range that doesn’t represent a normal oil-price environment in either direction. This quarter’s jump looks dramatic set against five quarters of data; set against four years of steady decline, it’s the first interruption in a trend that was otherwise running the opposite way, which is exactly why I’m not ready to call it a new baseline yet.
Why the “Historical Average” Here Is Misleading
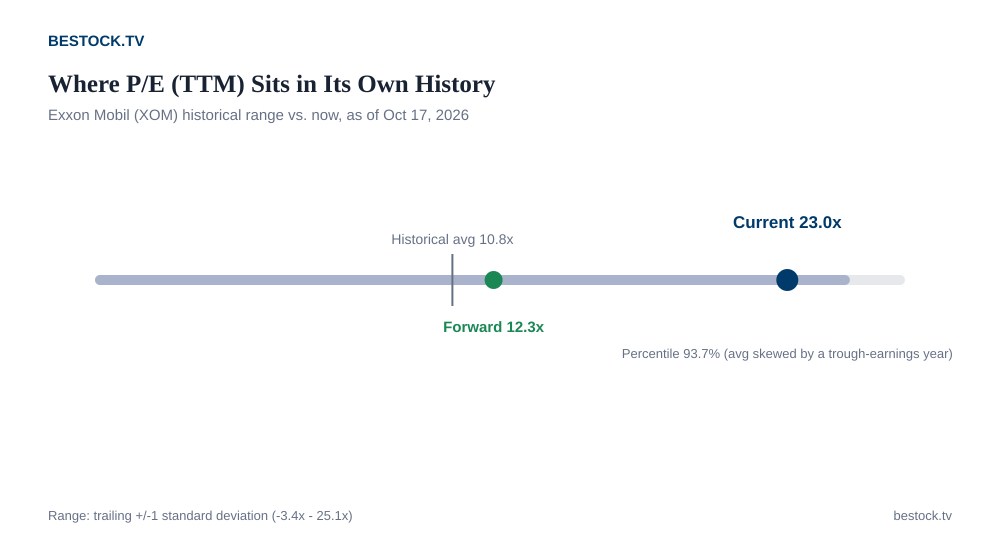
Current P/E (TTM) is 23.0, against a historical average of just 10.8 and a trailing band that runs from negative 3.4 to 25.1. That negative lower bound is your tell: Exxon’s own history includes stretches of near-zero or negative earnings during oil price collapses, and those periods drag the “average” multiple down to a level that doesn’t represent a normal operating environment. So while the percentile math says 93.7%, close to the richest this stock has ever been, I’d treat that number as exaggerated rather than take it at face value. The real question is simpler: is 23 times earnings reasonable for an oil major right now, on its own terms, not relative to a distorted average.
The Risk This Quarter’s Numbers Don’t Show
Everything I’ve walked through so far is backward-looking, and an oil major’s forward risk is almost entirely about a single input Exxon doesn’t control: the price of crude. A meaningful pullback in oil prices from current levels would compress margins and net income regardless of how well the company executes operationally, and that’s the single biggest swing factor in this stock, bigger than anything in the segment mix or cost structure. I don’t have a crude price forecast to offer here, and I’d be skeptical of anyone who claims real confidence in one over a multi-quarter horizon.
The slower-moving risk is the energy transition itself: policy support for renewables, EV adoption rates, and long-term demand growth assumptions all factor into how the market prices a company whose core business is still fossil fuel extraction and refining decades out. That’s not a this-quarter or even this-year risk, but it’s part of why I don’t think an oil major deserves the same kind of multiple expansion a growing tech company would get for the same earnings growth rate, even in a quarter as strong as this one.
Table: The Numbers Side by Side
| Metric | Value | Context |
|---|---|---|
| Share price | $178.69 | 52-week range $109.34 to $180.26, near the high |
| P/E (TTM) | 23.0 | 93.7th percentile, but average is skewed low |
| P/E (forward) | 12.3 | roughly half the TTM figure |
| Dividend yield | 2.28% | 40+ consecutive years of increases |
| Market cap | $734.7 billion | |
| Analyst rating | 16 analysts, 44% Buy | split, not a consensus call |
| Average price target | $172.44 | below the current price |
That forward P/E of 12.3, less than half the trailing figure, is the number that actually settles this for me. The market is pricing in a meaningful pullback in earnings from this quarter’s level, which tells me Wall Street views the $114.5 billion revenue print as a high-water mark, not a new baseline. The average price target sitting below the current share price backs that up: this isn’t a stock the sell-side is chasing higher right now.
Chevron Is the Comparison Worth Making
Chevron is the closest peer for sizing up whether Exxon’s multiple makes sense, since both are integrated majors exposed to the same crude price swings and the same energy-transition policy questions. The two stocks have historically traded at similar multiples for long stretches, with the gap between them widening mainly around company-specific events, major acquisitions, production guidance changes, rather than diverging macro views on oil. If Exxon’s multiple pulls meaningfully ahead of Chevron’s without a clear company-specific reason, that would be a signal to me that the market is pricing in more of this quarter’s strength than the commodity backdrop alone would justify.
What Would Change My Mind
If this quarter’s revenue jump turns out to be mostly organic, driven by production volumes and refining margins rather than a one-time item, and the next two quarters hold anywhere close to this level, then the forward multiple of 12.3 would look genuinely cheap rather than appropriately cautious. I don’t have the segment breakdown in front of me to settle that question today, so I’m flagging it rather than resolving it.
What I’m Doing, and the Number I’m Watching
I own Exxon for the dividend and I’m not selling on a single strong quarter, but I’m also not adding at a price that’s 93.7th percentile on trailing earnings, distorted average or not. The number I’m watching is next quarter’s revenue: anything holding above $95 billion would start to convince me this is a real step up in the business, not a one-time print. A drop back toward the $80 billion range would confirm my suspicion that this quarter was the exception, not the new rule.
Analysis and opinion only, not investment advice. Figures come from the company’s recent filings and our market data snapshot; the valuation percentile comparison and year-over-year figures are my own calculations.