
Barrick Mining: The Gold Trade That Still Has a Cost Problem
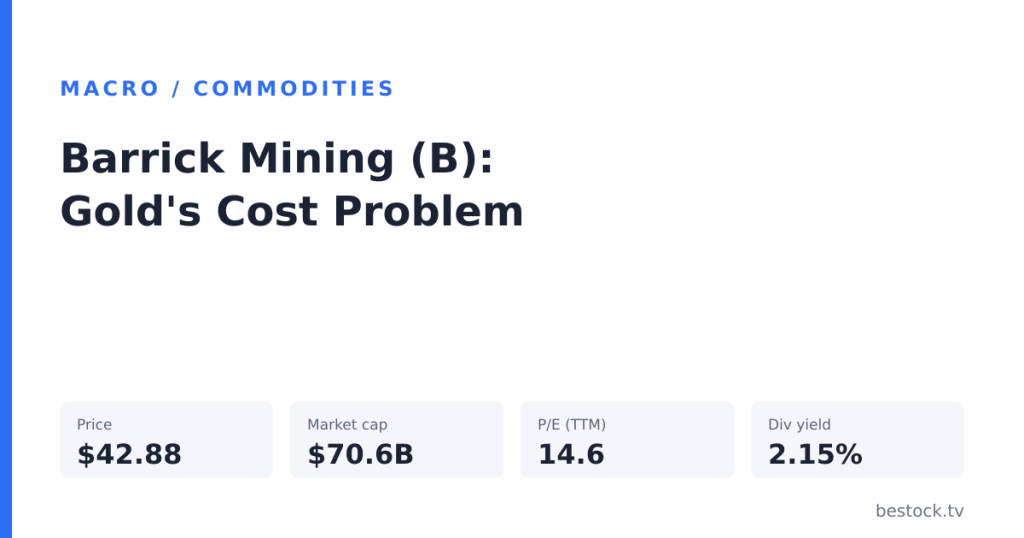
Barrick’s stock traded at $42.88 the last time I checked, and gold itself sat above $4,293 an ounce the same day. Neither number tells you much by itself. A gold miner’s economics live in the gap between those two figures, minus whatever it costs the company to actually pull ounces out of the ground, and that gap has been narrowing even while the gold price keeps grabbing every headline.
I’ve spent more of this year writing about commodity-linked stocks than almost anything else, partly because the price of the underlying commodity keeps surprising people who never look past the spot chart. I laid out a version of the same argument across five energy names not long ago, and the mechanism here rhymes: the commodity’s own price is only half the story, and often the smaller half.
Here’s the sentence I’d want in front of anyone pricing Barrick off the gold headline alone: full-year all-in sustaining costs are guided at $1,760 to $1,950 an ounce for 2026, after costs already rose 11% year over year last quarter, and that cost trend decides whether Barrick’s stock earns its current multiple. The gold price by itself doesn’t.
The spread that pays the bills
Start with the arithmetic, because it isn’t complicated even though gold-mining stocks often trade like it is. Barrick reported second-quarter 2026 all-in sustaining costs of $1,866 an ounce, up 11% from a year earlier, on production of 796,000 ounces that beat the company’s own guidance of 730,000 to 770,000 ounces. Costs rose. Production rose too, and by more than Barrick had told anyone to expect.
Set that $1,866 figure against spot gold above $4,293 an ounce and the margin per ounce is still wide. Using the low end of Barrick’s own full-year cost guidance, $1,760 an ounce, against today’s spot price leaves roughly $2,533 of margin on every ounce sold, by my math. At the high end of that same range, $1,950 an ounce, the margin is still north of $2,340. Either way, more than half of every dollar gold trades above zero survives as margin at Barrick, which is a far better picture than the cost headline alone suggests.
Costs rose faster than gold, briefly
The 11% cost increase is the number a bear case leans on, and it’s real. But gold’s own year-over-year gain has been decelerating too: it was up 95.6% year over year as of late January 2026, and by late September that annual gain had fallen to 13.9%, the smallest twelve-month gain in the current run. A cost line rising 11% against a commodity still compounding near 95% barely matters. The same cost line against a commodity whose annual gain has fallen to 13.9% matters a great deal more.
That’s the part of the Barrick case that depends on gold cooperating rather than on anything Barrick’s own operations control. I don’t think that’s a small caveat. Some quarters it’s the whole caveat.
Gold’s move over the past year has had less to do with jewelry demand or mine supply than with rate expectations and the dollar, the kind of macro flow I spend most of my time on. When real rates fall or the dollar weakens, gold tends to catch a bid regardless of what any single miner reports that quarter, and the reverse holds just as well. That’s the mechanism behind the deceleration I just described. Gold hasn’t turned bearish. The pace of the tailwind has slowed, and a slower tailwind changes the math for anyone valuing Barrick off gold’s trajectory rather than its level.
What the wide guidance range hides
Barrick’s 2026 production guidance spans 2.90 million to 3.25 million ounces, a band wide enough that hitting the low end instead of the high end changes full-year output by roughly 350,000 ounces, worth well over a billion dollars at today’s gold price. A guidance range that wide, on a company this size, tells me management isn’t confident enough in any single mine’s output to narrow it further, and one good quarter against quarterly guidance doesn’t resolve that on its own.
A 2.90-to-3.25-million-ounce range also means the gap between a good year and a merely adequate one shows up mostly in the back half of 2026, since Barrick doesn’t typically reset annual guidance mid-year unless something breaks. I’d treat every quarterly print between now and year-end as one data point on which end of that range looks more likely, not as proof either way on its own.
Barrick did flag good operational news this quarter. Pueblo Viejo recovered faster than expected from planned first-quarter maintenance, the Loulo-Gounkoto ramp-up is running ahead of schedule, and Cortez posted record underground production tied to the Goldrush development. I went looking for the kind of mine-specific disruption Barrick has had in past years, expecting to find one here. This quarter’s release reads the other way: recovery and ramp-up, not disruption. I’d rather report that plainly than manufacture a risk that isn’t currently showing up in the numbers.
A buyback instead of dilution
Gold miners have a well-earned reputation for diluting shareholders to fund growth, issuing new shares instead of returning cash. Barrick did the opposite in May 2026: its board authorized a $3.0 billion share repurchase, aimed, in the company’s own words, at returning cash “at a time when Barrick sees exceptional value in its own shares.” At a $42.88 share price and roughly a $70.6 billion market cap, that implies something like 1.65 billion shares outstanding, by my calculation, and a buyback that size could retire a meaningful slice of that count if it’s fully executed.
The same announcement ties the buyback to something else entirely: the planned initial public offering of Barrick’s North American business. I don’t have a clean read on how that separation reshapes the parent company’s share count, its cost structure, or which ounces stay inside “Barrick” once it’s done, so I’d treat any full buyback math as provisional until that structure is actually final.
Where the stock sits against its own multiple
Barrick trades at 14.63 times trailing earnings and pays a 2.15% dividend yield, both approximate and current as of my last check. Figures that look almost conservative next to the multiples attached to anything AI-adjacent this year. A sub-15 P/E on a company clearing a margin above $2,300 an ounce, even using the expensive end of its own cost guidance, isn’t a stock priced for gold to keep doing what it did in 2025.
Here’s where that snapshot sits together, cost and production guidance next to the valuation and buyback figures I just walked through.
| Metric | Barrick now | Context |
|---|---|---|
| AISC (Q2 2026) | $1,866/oz | up 11% year over year |
| AISC guidance (FY2026) | $1,760–$1,950/oz | full-year range |
| Gold production (Q2 2026) | 796,000 oz | beat guidance of 730,000–770,000 oz |
| Gold spot price | $4,293.20/oz | +13.9% year over year, down from +95.6% in January |
| Trailing P/E | 14.63 | approximate, as of last check |
| Dividend yield (TTM) | 2.15% | trailing basis |
| Market cap | ~$70.6 billion | implies ~1.65 billion shares at $42.88 |
| Buyback authorization | $3.0 billion | authorized May 2026 |
Compare that to how I’ve sized up other commodity producers this year. Exxon’s stock, which I looked at through Guyana output and a cheaper cost per barrel out of the Permian, runs on similar logic: the commodity price sets the ceiling, and the company’s own cost structure decides how much of that ceiling reaches shareholders. Barrick’s version of that math just carries a much larger cost figure per unit, because gold mining runs in the thousands of dollars an ounce rather than tens of dollars a barrel.
Barrick traded for years as Barrick Gold before this year’s rebrand to Barrick Mining. I’m not building any part of the case above on the reasoning behind that name change, only on the gold-specific cost and production figures already covered, which is still where the bulk of the current business sits.
The case that breaks this thesis
Here’s the specific way I’d be wrong about all of this. If gold’s year-over-year gain keeps decelerating toward the high single digits while Barrick’s AISC guidance drifts toward the top of its $1,760 to $1,950 range on the next earnings call, the margin story here shrinks fast. A 14.63 P/E stops looking cheap and starts looking like a fair price for a business whose profit per ounce is actually shrinking. Costs up, gold’s own momentum down, at the same time. That’s the combination that would change my mind. A North American spinoff that shrinks Barrick’s own ounce count without a matching cut to shares outstanding would break this math too, even with gold and costs behaving exactly as guided.
I don’t think that’s this quarter’s story. The production beat and the operational updates at Pueblo Viejo, Loulo-Gounkoto, and Cortez argue the other way. But it’s the scenario I’d want ruled out before calling this stock cheap rather than merely cheap-looking.
The number I’m watching next isn’t the gold price. It’s Barrick’s next all-in sustaining cost print measured against its own $1,760 to $1,950 guidance, next to whatever gold’s year-over-year gain looks like by the time that print lands. Costs near the low end with gold holding anywhere close to current levels still make the margin math here work. Costs drifting toward the high end while gold’s annual gain keeps compressing toward single digits is the combination that would send me looking for an exit instead of adding.
Analysis and opinion only, not investment advice. Figures come from Barrick Mining’s own second-quarter 2026 results and its May 2026 buyback announcement, both published on barrick.com; gold spot pricing and its year-over-year change come from Yahoo Finance; share count, valuation multiples, and per-ounce margin figures are my own calculations and were checked on 2026-09-26.